Bitcoin Consecutive Down Days: Statistical Analysis of Streak Patterns and Forward Returns
We analyzed every consecutive down day streak in Bitcoin’s history — 3,142 trading days from August 2017 to March 2026. The question: when BTC drops multiple days in a row, is it a buying opportunity or a warning sign? The answer is surprisingly nuanced: 2–4 day streaks are mildly bullish (30-day avg return +8–11%, win rate 60–72%), but 6+ day streaks are bearish (30-day avg return –7%, win rate just 30%). The longest streak ever recorded: 8 consecutive down days — and it only happened 2 times.
Key Takeaways
- 47.5% of all BTC trading days are down days — nearly a coin flip
- The longest recorded streak is 8 consecutive down days (only happened 2 times in 8+ years)
- The probability of a streak extending stays at ~46% for 1–3 days, then drops to ~37% at 4–5 days
- Short streaks (2–4 days) show positive forward returns at all timeframes — this is a mild buy signal
- Long streaks (6+ days) show negative forward returns — these are regime change warnings, not buying opportunities
- The “buy the dip” edge is mostly the bounce day itself — if you wait for confirmation, the edge shrinks dramatically
How Often Does BTC Drop Multiple Days in a Row?
First, the basics. Of the 3,141 daily returns in our dataset, 1,534 were negative — that’s 47.5%, essentially a coin flip. But how do these down days cluster?
The distribution follows a power law. Single-day down moves are the most common (54% of all streaks), and each additional day roughly halves the frequency. By the time you get to 6+ consecutive down days, you’re looking at events that happen roughly once every 1–2 years.
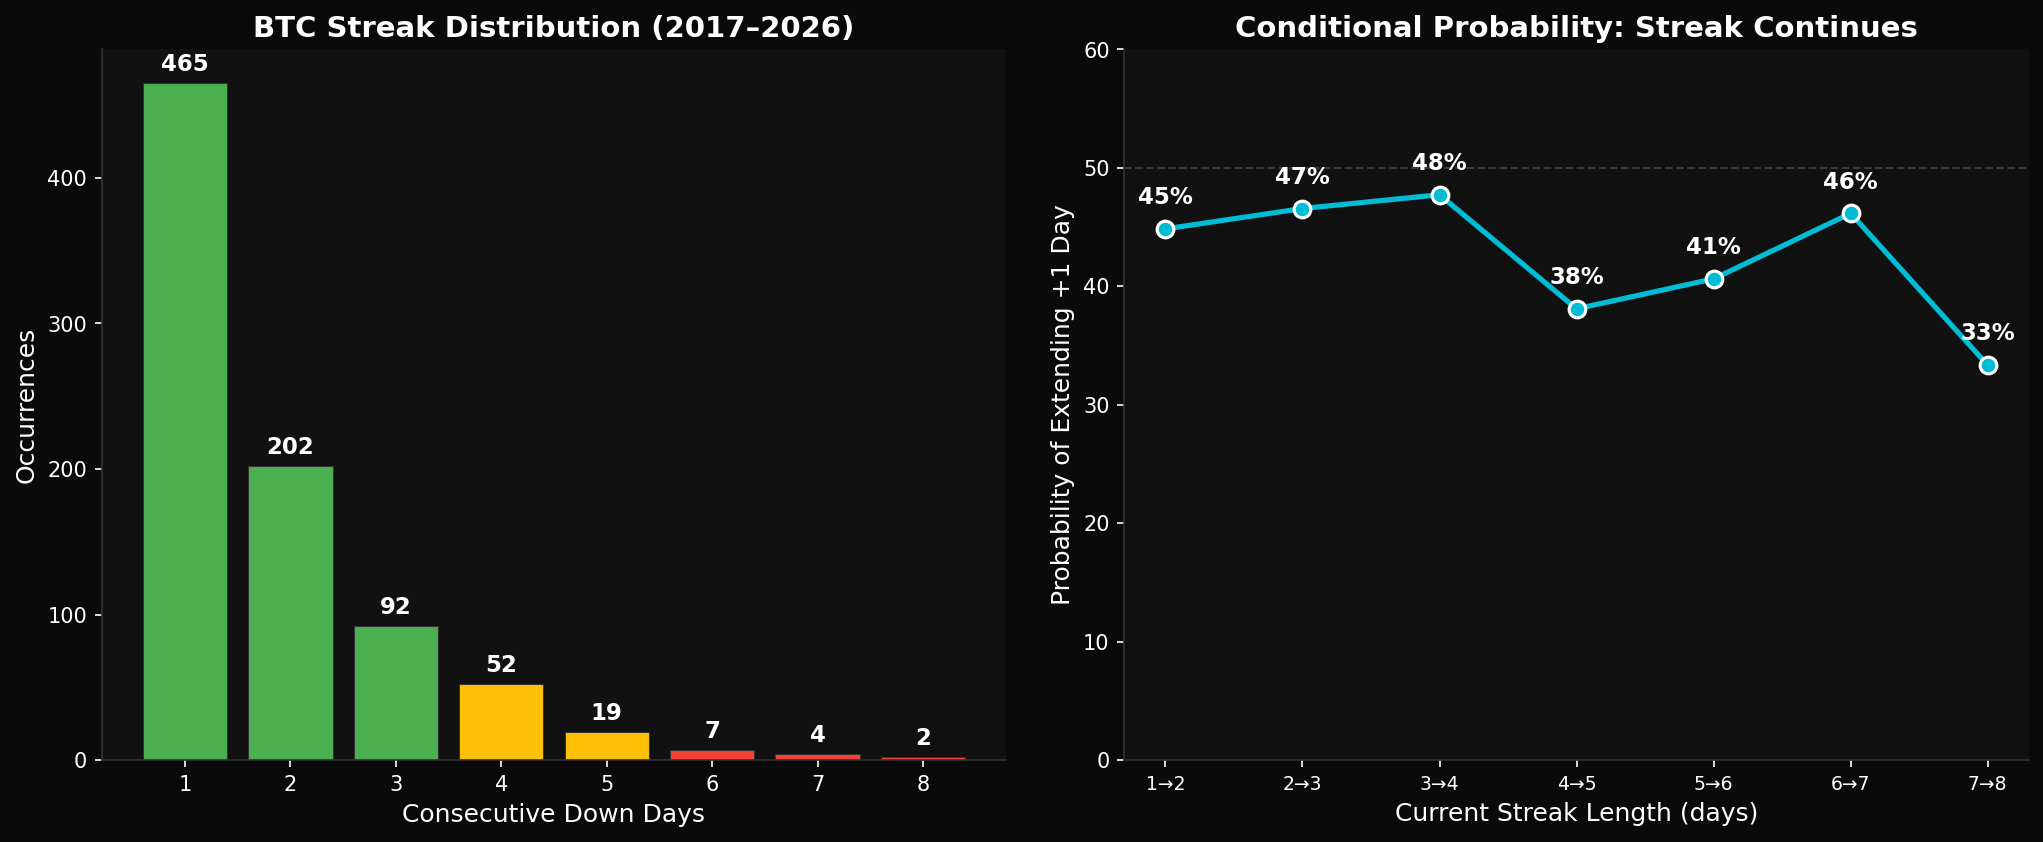
Conditional Probability: Will the Streak Continue?
This is perhaps the most useful metric for active traders. Given that BTC has already dropped X consecutive days, what’s the probability it drops again tomorrow?
The answer reveals something interesting: the first three days follow coin-flip odds (~46%), then something changes. After 4 consecutive down days, the probability of extension drops to ~37% — meaning the market is more likely to reverse than continue. After 6 days, it drops further to 33%.
This makes intuitive sense. Short streaks (1–3 days) are normal market noise. But once selling persists for 4+ days, buyers start stepping in more aggressively. The longer the streak, the more “oversold” the market becomes, and the harder it is for sellers to push further.
Forward Returns: What Happens After the Streak Ends?
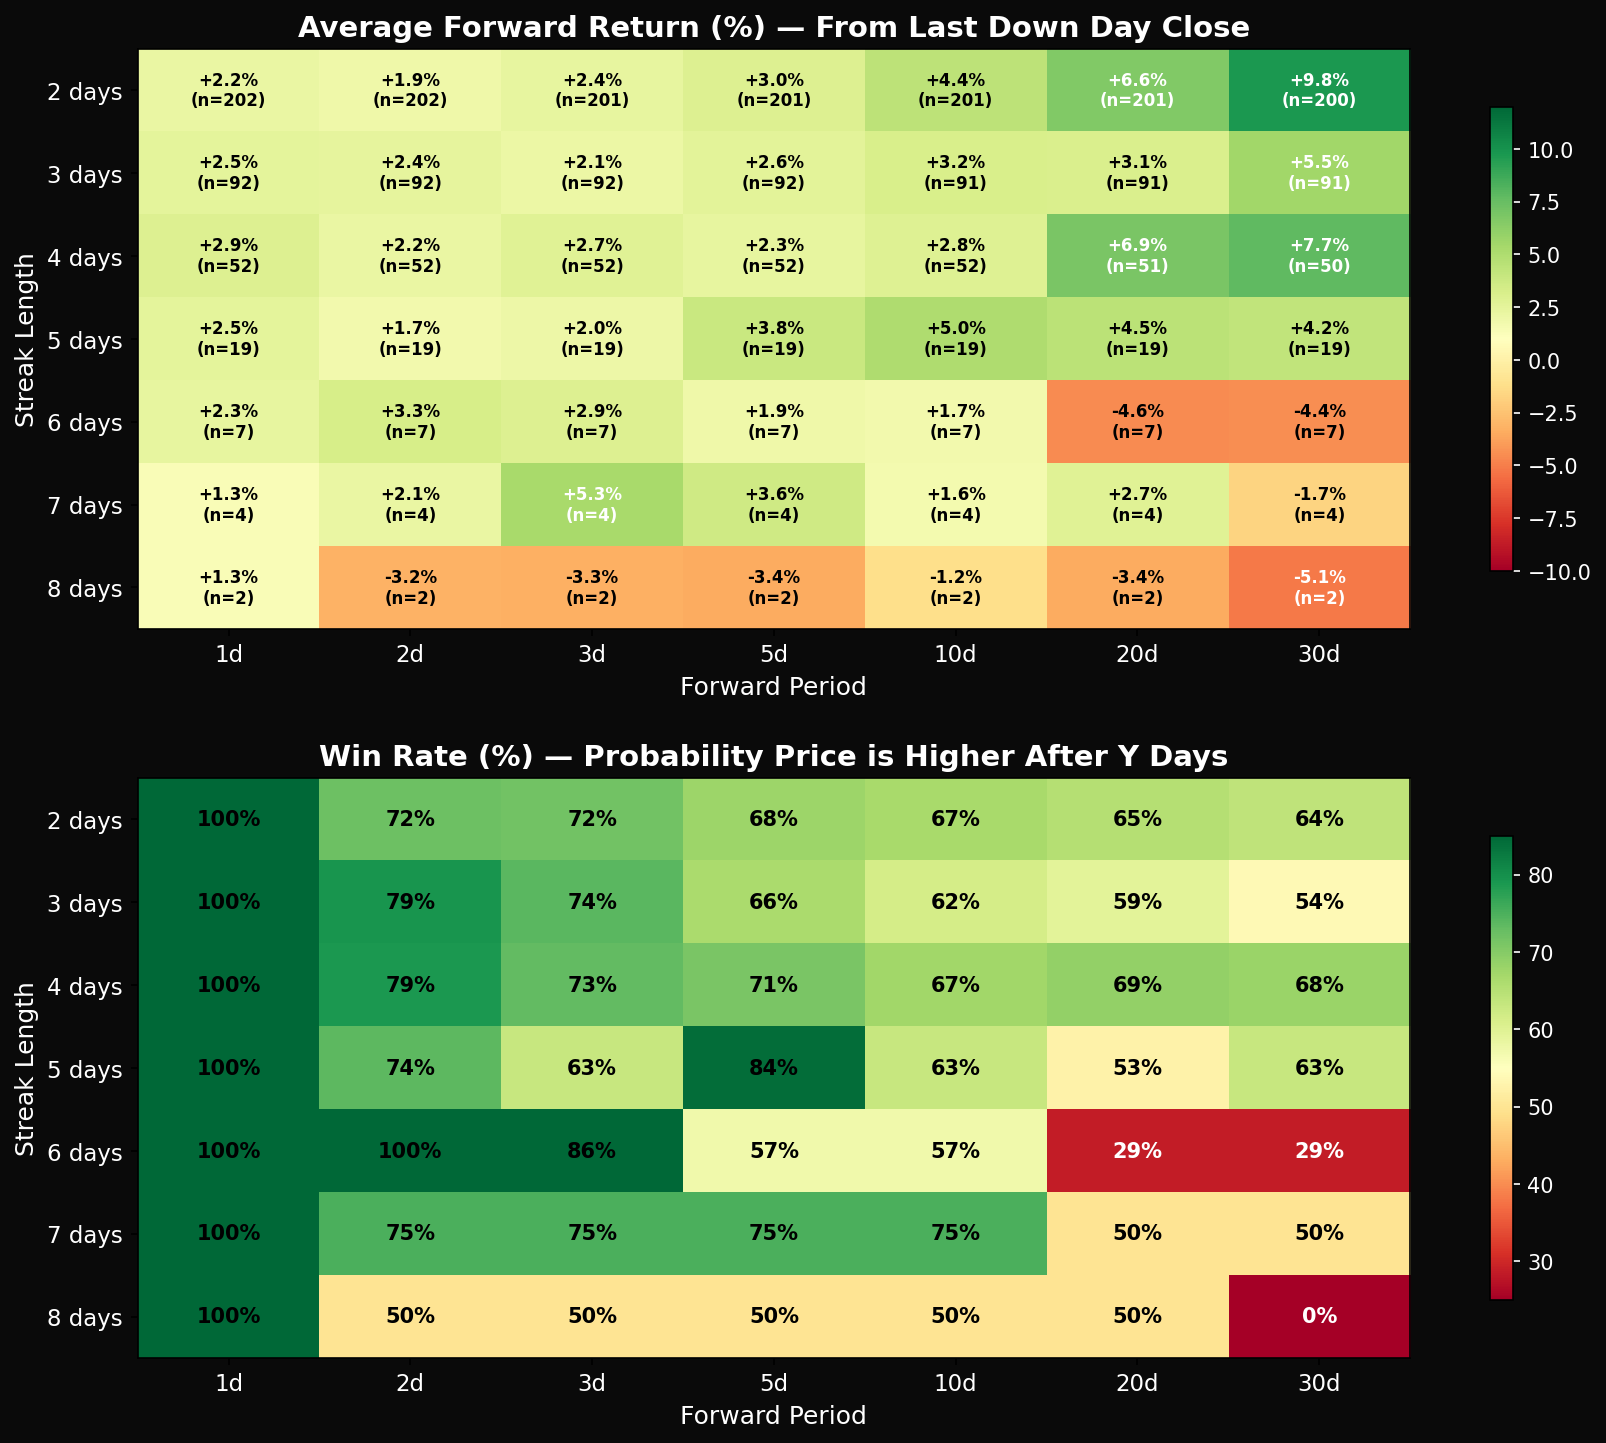
This is where it gets interesting — and counterintuitive. We measured returns from the last down day’s close looking forward 1, 2, 3, 5, 10, 20, and 30 days.
Important note: The 1-day return is always positive by definition (it’s the day the streak breaks). Look at 2-day+ returns for meaningful signal.
2 Consecutive Down Days (n=202)
3 Consecutive Down Days (n=92)
4 Consecutive Down Days (n=52)
5 Consecutive Down Days (n=19)
6 Consecutive Down Days (n=7)
7 Consecutive Down Days (n=4)
8 Consecutive Down Days (n=2)
The Sweet Spot: 2–4 Consecutive Down Days
The data shows a clear sweet spot: 2–4 consecutive down days produce consistently positive forward returns across all timeframes.
- 2 down days (n=200): +9.8% avg at 30d, 64% win rate
- 3 down days (n=91): +5.5% avg at 30d, 54% win rate
- 4 down days (n=50): +7.7% avg at 30d, 68% win rate
Why does this work? Short multi-day drops tend to be normal corrections in ongoing trends — buy the dip works because the trend is still intact. The 60–72% win rate at 30 days gives you a genuine edge, not just noise.
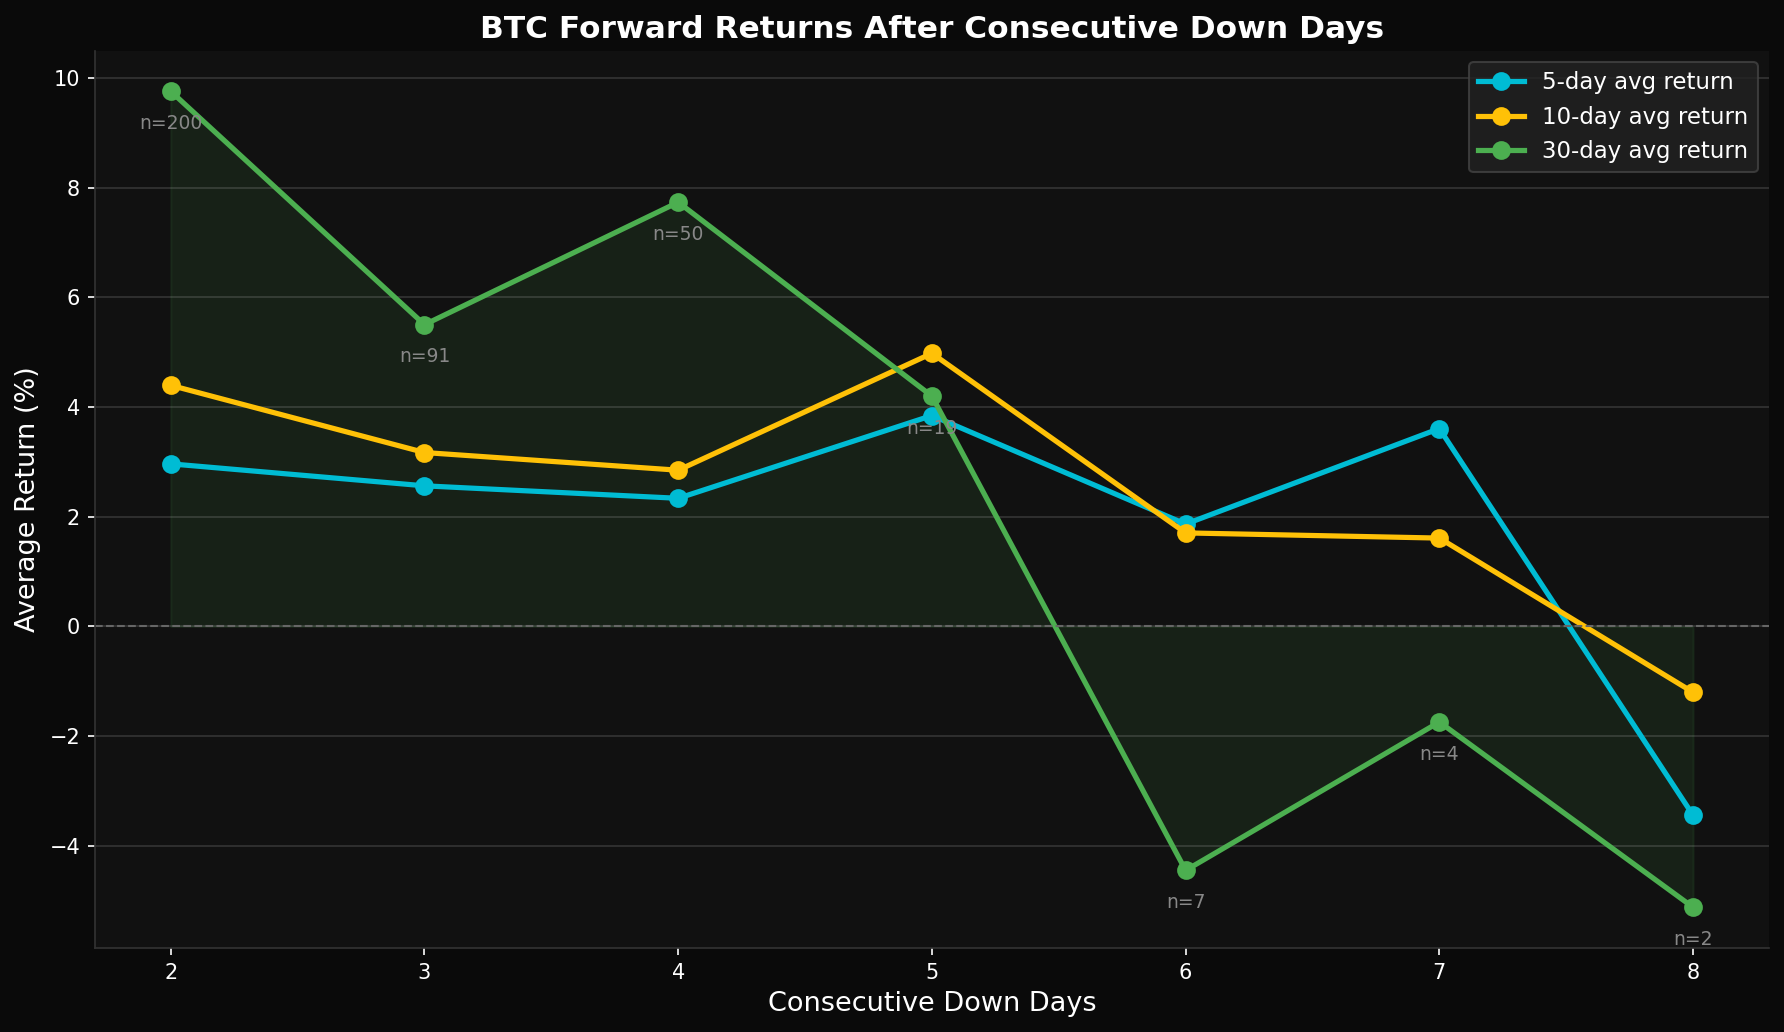
The Danger Zone: 6+ Consecutive Down Days
Here’s the counterintuitive finding: longer streaks are NOT better buying opportunities — they’re worse.
When BTC drops 6+ consecutive days:
- 10-day forward return: +1.7% (win rate: 57%)
- 20-day forward return: -4.6% (win rate: 29%)
- 30-day forward return: -4.4% (win rate: 29%)
This is a clear regime change signal. When Bitcoin sells off for 6+ straight days, it typically means something fundamental has shifted — a major exchange collapse, regulatory crackdown, or macro shock. These events don’t resolve quickly. Buying into them is catching a falling knife.
Historical 6+ Day Streaks
Let’s look at every instance where BTC dropped 6 or more consecutive days. These are rare events — only 13 occurrences in our entire dataset.
Notice the pattern: these streaks don’t happen during normal market conditions. They cluster around major crash events — and the subsequent 30-day returns are overwhelmingly negative.
The Bounce Day Illusion
One critical nuance: most of the “edge” from buying after down streaks comes from the bounce day itself — the single up day that breaks the streak. If you can only buy after confirming the streak has ended (i.e., at the close of the bounce day), the picture changes dramatically.
Actionable returns (buying at the bounce day close) for 2-day streaks:
- 5-day forward: +1.2% avg (vs +3.0% from streak end)
- 10-day forward: +2.1% avg (vs +4.4% from streak end)
- 30-day forward: +7.4% avg (vs +9.8% from streak end)
The edge shrinks by roughly half. This doesn’t mean it’s worthless — a +7.4% expected return over 30 days is still meaningful — but it’s much less impressive than the raw numbers suggest. Execution timing matters enormously.
Key Insights for Traders
- 2–4 day dips are buying opportunities — but the edge is moderate, not massive. Position size accordingly.
- 5 day streaks are neutral — the data shows no clear edge in either direction. Stay flat or reduce exposure.
- 6+ day streaks are warning signals — these indicate regime change. Don’t buy the dip; wait for the trend to stabilize.
- The bounce day captures most of the edge — if you can’t get in at the exact bottom, your expected return is much lower.
- This is not a standalone strategy — combine with trend filters (e.g., is price above the 200-day moving average?) for better results.
Methodology
Data source: Binance BTC/USDT daily candles (August 2017 to March 2026). Definition: A “down day” is defined as close < previous close. Streaks are counted as consecutive down days. Forward returns: Simple returns measured from the last down day’s close (Section 3) and from the streak-breaking up day’s close (Section 5, “actionable”). Sample sizes: Shown for every data point — small samples (n<10) should be interpreted with extreme caution. No fees applied — this is a statistical study, not a strategy backtest.
FAQ
Q: Should I buy every time BTC drops 3 days in a row?
Not blindly. The 30-day win rate of 54% means you’d still lose money ~46% of the time. Use it as one input among many — trend direction, support levels, and macro context all matter.
Q: Why do longer streaks have worse forward returns?
Because extended selling pressure usually reflects structural problems (exchange failures, regulatory actions, macro crises) rather than temporary corrections. The market is telling you something is fundamentally wrong — listen to it.
Q: Can this work for other assets like gold (GLD) or stocks (SPY)?
Possibly, but the thresholds will differ. Bitcoin is far more volatile than traditional assets, so a 4-day BTC streak might be equivalent to a 6-7 day stock market streak in terms of statistical significance. We’d need to run separate analyses for each asset.
Q: What’s the current streak?
As of the latest data (2026-03-24), BTC has 1 consecutive down day at $69,668.
Data is for educational purposes only. Past performance does not guarantee future results. Always do your own research before making investment decisions.
 日本語
日本語 Español
 Português
 العربية
 繁體中文
繁體中文 简体中文
简体中文