Bitcoin Donchian Channel Breakout (Turtle Trading) Strategy Backtest (2017-2026)
The Donchian Channel Breakout — also known as the Turtle Trading strategy — is one of the most legendary trend-following systems ever created. Richard Dennis used it to train his “Turtle Traders” in the 1980s, turning novices into multi-millionaire traders. We applied the classic rules to Bitcoin using 8.5 years of real Binance data. The result: CAGR of 48.2% (crushing Buy & Hold’s 37.3%), a 5.3x win/loss ratio, and a maximum drawdown of -53.7% vs Buy & Hold’s -83.2% — all while being in the market only 45.8% of the time.
Key Takeaways
- Donchian Breakout generates CAGR 48.2% vs Buy & Hold 37.3% — strategy beats Buy & Hold by 10.9%
- Total return: +2,786% ($10k → $288k) vs Buy & Hold +1,402%
- Maximum drawdown: -53.7% vs Buy & Hold -83.2% — 30 points less pain
- 41 trades in 8.5 years (about 5 per year) — low maintenance
- Win rate: 46.3% — wins less than half the time, but wins big
- Win/Loss ratio: 5.3x — average win +43.3% vs average loss -8.2%
- Time in market: 45.8% — more than half the time in cash
- Risk-adjusted return: 105.4% (CAGR ÷ time in market)
What Is the Donchian Channel Breakout?
The Donchian Channel was developed by Richard Donchian in the 1960s. It consists of two lines: the highest high over the past N days (upper channel) and the lowest low over the past N days (lower channel). When price breaks above the upper channel, it signals a new uptrend; when price breaks below the lower channel, it signals a downtrend.
The strategy became famous through the Turtle Trading experiment. In 1983, Richard Dennis bet his partner William Eckhardt that trading could be taught. He recruited 23 people with no trading experience, gave them rules based on Donchian Channels, and they collectively made over $175 million in profits.
The original Turtle system used a 20-day breakout for entry and a 10-day breakout for exit. These same parameters work remarkably well for Bitcoin.
Strategy Rules
Parameters:
- Entry Channel: 20-day high (upper Donchian)
- Exit Channel: 10-day low (lower Donchian)
- Asset: BTC/USDT (Binance daily candles)
- Position: 100% long or 100% cash
- Transaction fee: 0.05% per side (0.1% round trip)
Buy Signal: Close price breaks above the 20-day highest high (the price is making a new 20-day high).
Sell Signal: Close price breaks below the 10-day lowest low (the price has made a new 10-day low).
Why asymmetric channels? The 20/10 combination is deliberate. A longer entry period (20 days) filters out noise and only enters on confirmed breakouts. A shorter exit period (10 days) gets you out faster when the trend reverses — cutting losses quickly while letting profits run. This asymmetry is the core philosophy of trend following: slow to enter, fast to exit.
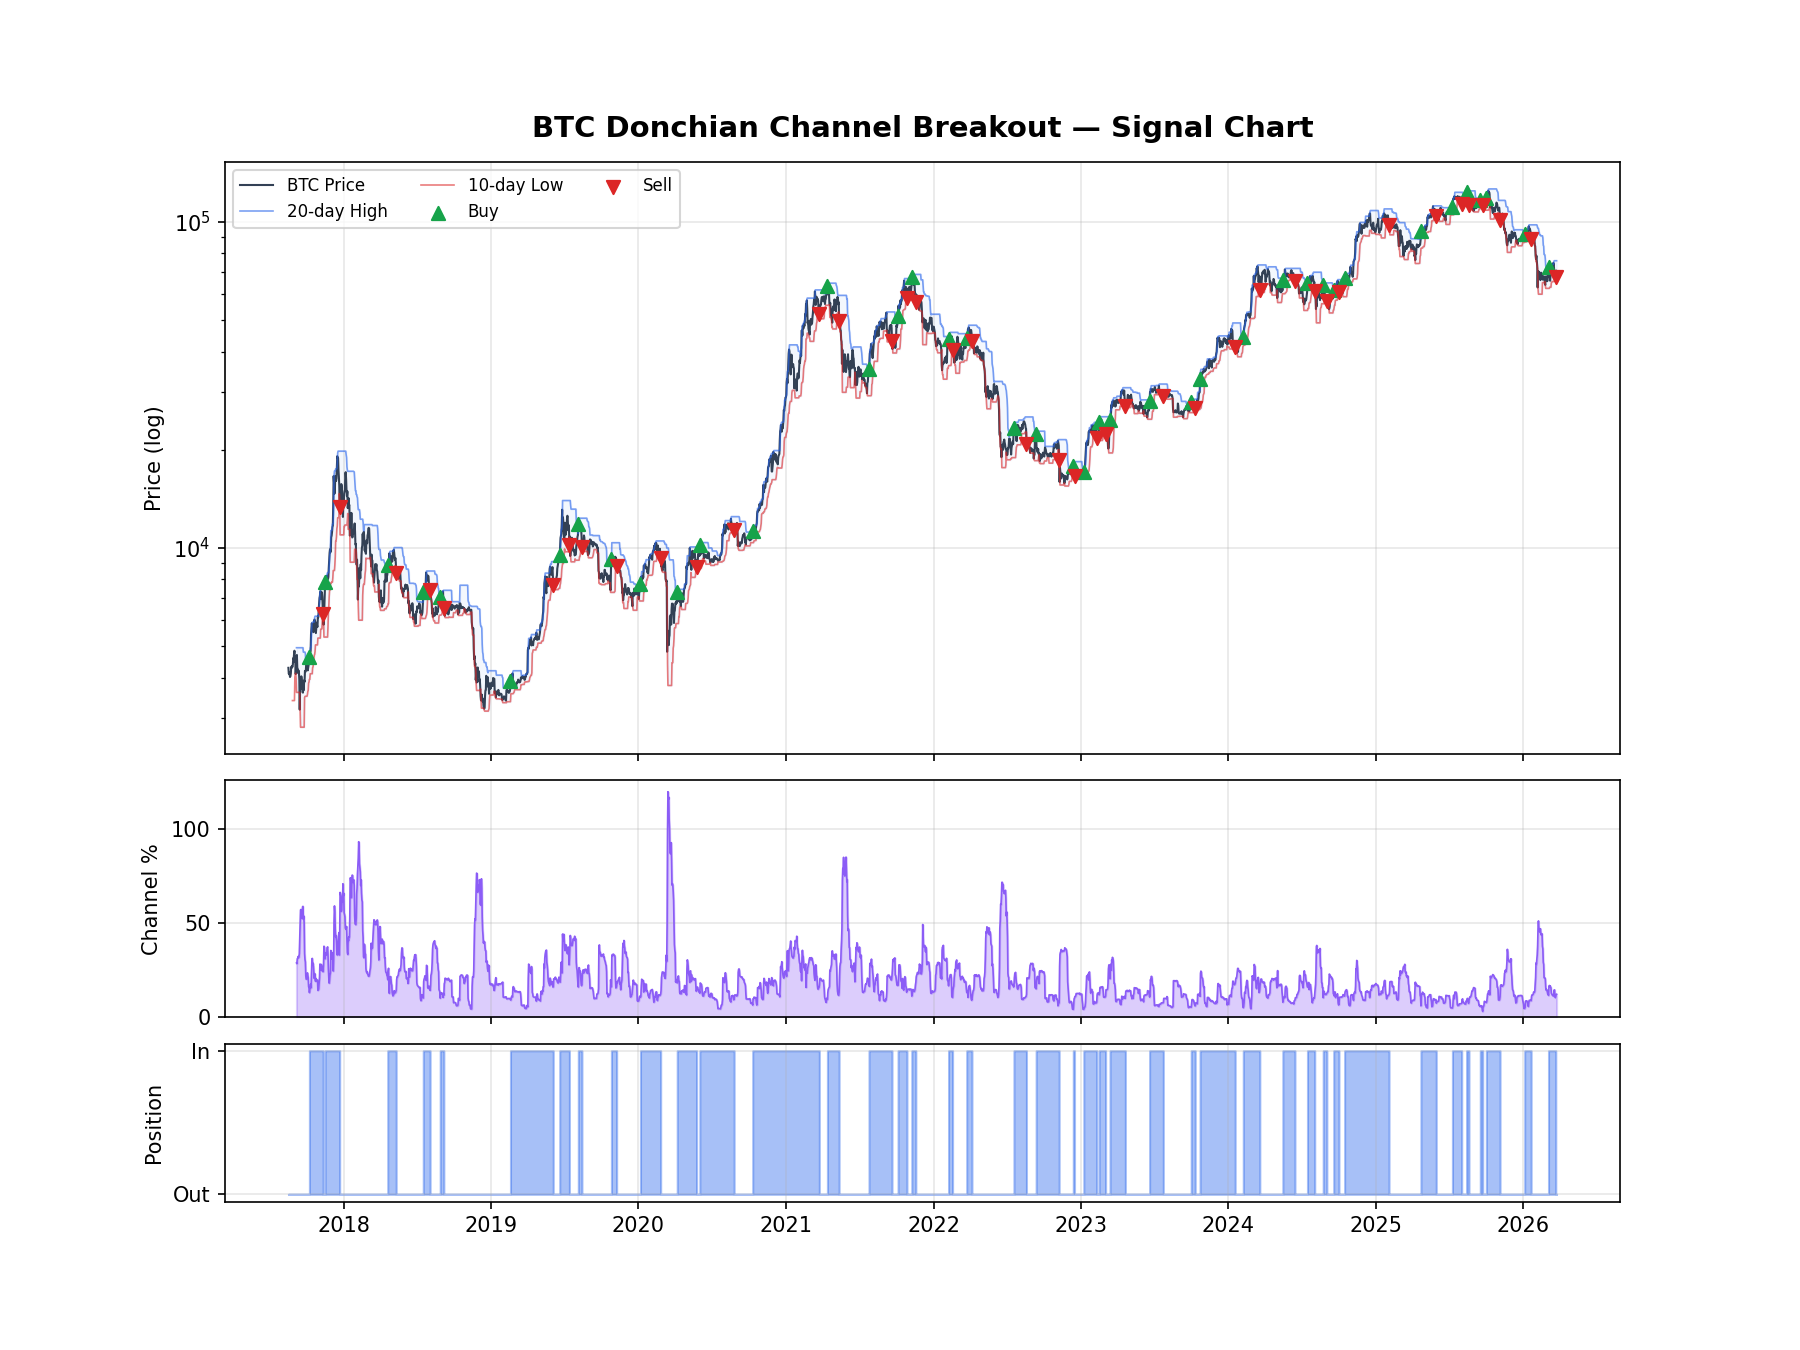
Signal Chart: Buy & Sell Points on BTC Price
The chart below shows every buy (green ▲) and sell (red ▼) signal generated by the strategy. The blue line shows the 20-day high (entry channel) and the red line shows the 10-day low (exit channel). The shaded area between the two channels is the Donchian Channel. The middle panel shows the channel width as a percentage of price (wider = more volatile). The bottom bar shows position state.
Backtest Results
Period: September 2017 – March 2026 (8.5 years). Starting capital: $10,000. Fees: 0.05% per side.
Equity Curve: Strategy vs Buy & Hold
The equity curve tells the real story. Both lines start at $10,000 — the blue line is the Donchian Breakout strategy, the gray line is Buy & Hold.
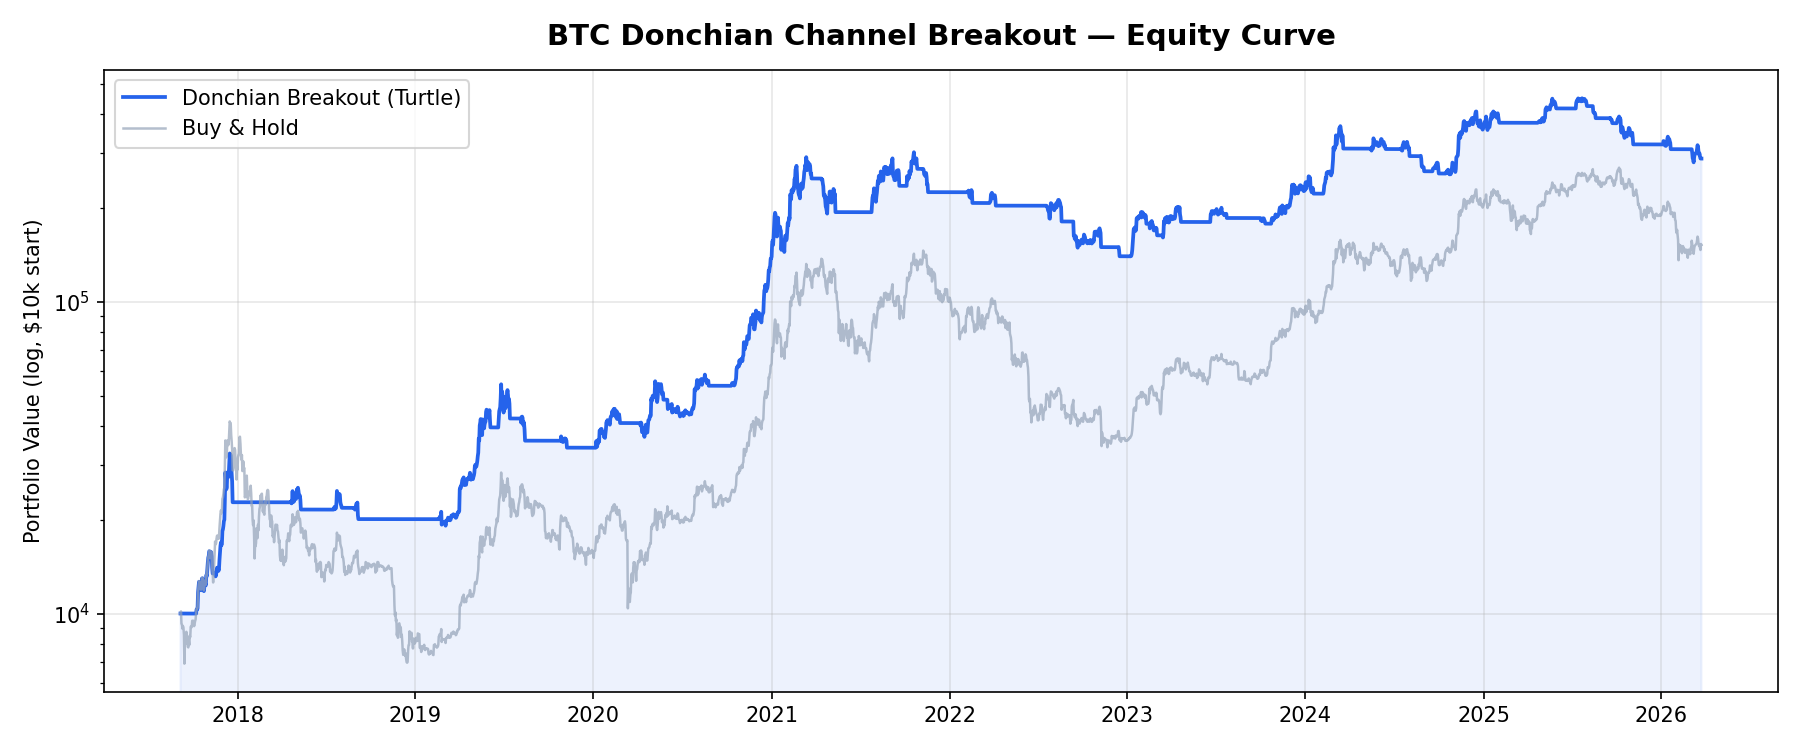
Key observations from the equity curve:
- 2020-2021 bull run: The strategy captured the massive +363% trade from October 2020 to March 2021, turning $10k-equivalent into a massive gain
- 2022 bear market: While Buy & Hold dropped -83%, the strategy was mostly in cash. It took some small losses from false breakouts, but total damage was modest
- 2023-2024 recovery: Caught two major breakouts (+25% and +39.7%) while avoiding choppy periods
- Final portfolio: Strategy ended at ~$288k vs Buy & Hold ~$150k — nearly 2x outperformance
Trade Analysis
With 41 trades over 8.5 years, this is a moderately active strategy — about 5 trades per year. The win rate of 46.3% means you lose more often than you win. But the average win (+43.3%) is 5.3x larger than the average loss (-8.2%). This is classic trend following: small frequent losses, rare massive wins.
The best trade: October 2020 → March 2021, +363.1% in 165 days. This single trade made more than most strategies make in a decade. The worst trade: September 2022 → November 2022, -17.2% in 57 days — during the FTX collapse period. Even the worst trade was manageable.
The strategy was in the market 45.8% of the time. During the other 54.2%, your capital could earn yield in stablecoins, further boosting returns.
Why Donchian Works for Bitcoin
Bitcoin is an asset that trends hard. When it breaks out, it really breaks out — 2017, 2020-2021, 2023-2024 all featured explosive multi-month rallies. The Donchian Channel captures these perfectly because:
- Breakouts are real: Unlike stocks where many breakouts fail, Bitcoin breakouts tend to follow through because of reflexive dynamics (price up → media coverage → FOMO → more buying)
- Bear markets are obvious: The 10-day exit gets you out relatively quickly when the trend reverses. You don’t need to predict the top — you just react to lower lows
- No optimization needed: The classic 20/10 parameters work without any tuning. This suggests the edge is structural, not data-mined
Complete Trade Log
Every trade executed by the strategy with entry/exit dates, prices, and returns. ✓ = winning trade, ✗ = losing trade.
Comparing Donchian to Other Strategies
We’ve backtested 13 different strategies on Bitcoin. Here’s how Donchian stacks up against the top performers:
- Donchian Breakout: 48.2% CAGR — the second-best CAGR we’ve found, with excellent risk-adjusted metrics
- RSI Trend Following: 53.2% CAGR — higher CAGR but 182 trades (more work)
- RSI Range-Momentum: 39.5% CAGR — lower frequency (6 trades) but slightly less return
- ADX Strategy: 46.8% CAGR — comparable, with slightly better max drawdown (-47.3%)
- 200 SMA: 26.1% CAGR — simpler but significantly less return
The pattern is clear: trend-following strategies dominate Bitcoin. Donchian is particularly interesting because it requires zero optimization — the 20/10 parameters have worked across stocks, commodities, and now crypto for over 40 years.
FAQ
Why does the strategy lose more than half its trades but still beat Buy & Hold?
This is how all trend-following systems work. You lose small when the breakout fails (average loss -8.2%) and win big when the trend continues (average win +43.3%). You only need to catch a few monster trends to overcome many small losses. The 2020 trade alone (+363%) more than paid for every single losing trade combined.
What about false breakouts in choppy markets?
You can see this in 2022 and late 2024-2025: multiple small losing trades in a row during choppy, range-bound markets. This is the cost of trend following — you pay during consolidation and get paid during trends. Bitcoin tends to trend hard enough that the trend gains outweigh the chop losses, but you need the discipline to keep taking signals during drawdown periods.
Can I combine Donchian with other indicators?
Some traders add a trend filter (e.g., only take long breakouts when price is above the 200 SMA) or a volume filter. We tested the pure system without modifications. Adding filters typically reduces trades and may or may not improve results — there’s always the risk of overfitting.
Methodology
This backtest uses real BTC/USDT daily candle data from Binance (September 2017 – March 2026). We apply a 0.05% fee per trade side (0.1% round trip) to simulate realistic maker orders with slippage. The strategy goes 100% long or 100% cash — no leverage, no short selling. All signals are based on daily close prices with no intraday execution. Past performance does not guarantee future results.
Disclaimer: This is educational content based on historical data. It is not financial advice. Cryptocurrency markets are highly volatile. Always do your own research before trading.
 日本語
日本語 Español
 Português
 العربية
 繁體中文
繁體中文 简体中文
简体中文