Bitcoin RSI Range-Momentum Strategy Backtest (2017-2026)
The RSI Range-Momentum strategy combines two concepts from Arthur Hill’s research: RSI Bull Range (RSI staying above 40) and RSI Bull Momentum (RSI exceeding 70) over a rolling lookback window. We adapted it for Bitcoin using a 75-day window — optimized for crypto’s faster cycles — and tested it against 8+ years of real BTC data. The result: 6 trades, 83% win rate, CAGR of 39.5% (beating Buy & Hold’s 32.9%), and 20 percentage points less drawdown — while only being in the market 35.6% of the time.
Key Takeaways
- RSI Range-Momentum is a low-frequency regime filter: only 6 trades in 8.4 years
- CAGR of 39.5% vs Buy & Hold’s 32.9% — strategy beats Buy & Hold
- Win rate: 83.3% — only 1 losing trade out of 6
- Maximum drawdown: -63.7% vs Buy & Hold’s -83.2%
- Time in market: 35.6% — idle capital can earn yield elsewhere
- Risk-adjusted return: 111.0% (CAGR ÷ time in market)
- Win/Loss ratio: 8.3x — average win +96.8% vs average loss -11.7%
What Is RSI Range-Momentum?
Most traders use RSI (Relative Strength Index) for overbought/oversold signals — buy when RSI drops below 30, sell above 70. But research by Arthur Hill at StockCharts introduced a different framework: RSI ranges.
The insight is simple: in a bull market, RSI tends to oscillate between 40 and 100 — it rarely drops below 40. In a bear market, RSI oscillates between 0 and 60, rarely exceeding 60. Instead of using RSI as a contrarian indicator, you use the range of RSI values to identify the market regime.
The RSI Range-Momentum strategy combines two conditions over a rolling lookback window:
- RSI Bull Range: The minimum RSI value over the lookback period stays above 40 (RSI never dips into bear territory)
- RSI Bull Momentum: The maximum RSI value over the lookback period exceeds 70 (at some point, strong bullish momentum appeared)
When both conditions are true simultaneously, the market is in a confirmed bullish regime with proven momentum. When both conditions fail, the regime has shifted bearish.
Strategy Rules
Parameters:
- RSI Period: 14 (standard)
- Lookback Window: 75 days (adapted for Bitcoin — the original stock market research uses 100 days, but crypto cycles are faster; see “Why 75 Days?” below)
- Bull Range Floor: RSI minimum ≥ 40
- Bull Momentum Threshold: RSI maximum ≥ 70
- Asset: BTC/USDT (Binance daily)
- Transaction fee: 0.05% per side (0.1% round trip)
Buy Signal: Enter long when BOTH conditions are true over the past 75 days:
- RSI Bull Range — RSI has not dropped below 40 in the past 75 days
- RSI Bull Momentum — RSI has exceeded 70 at least once in the past 75 days
Sell Signal: Exit when BOTH conditions are false (RSI has dipped below 40 AND RSI has not exceeded 70 in the past 75 days).
Key nuance: If only one condition flips while the other holds, you stay in the trade. This creates a “sticky” position that doesn’t get whipsawed by temporary RSI dips — you only exit when the regime has fully shifted.
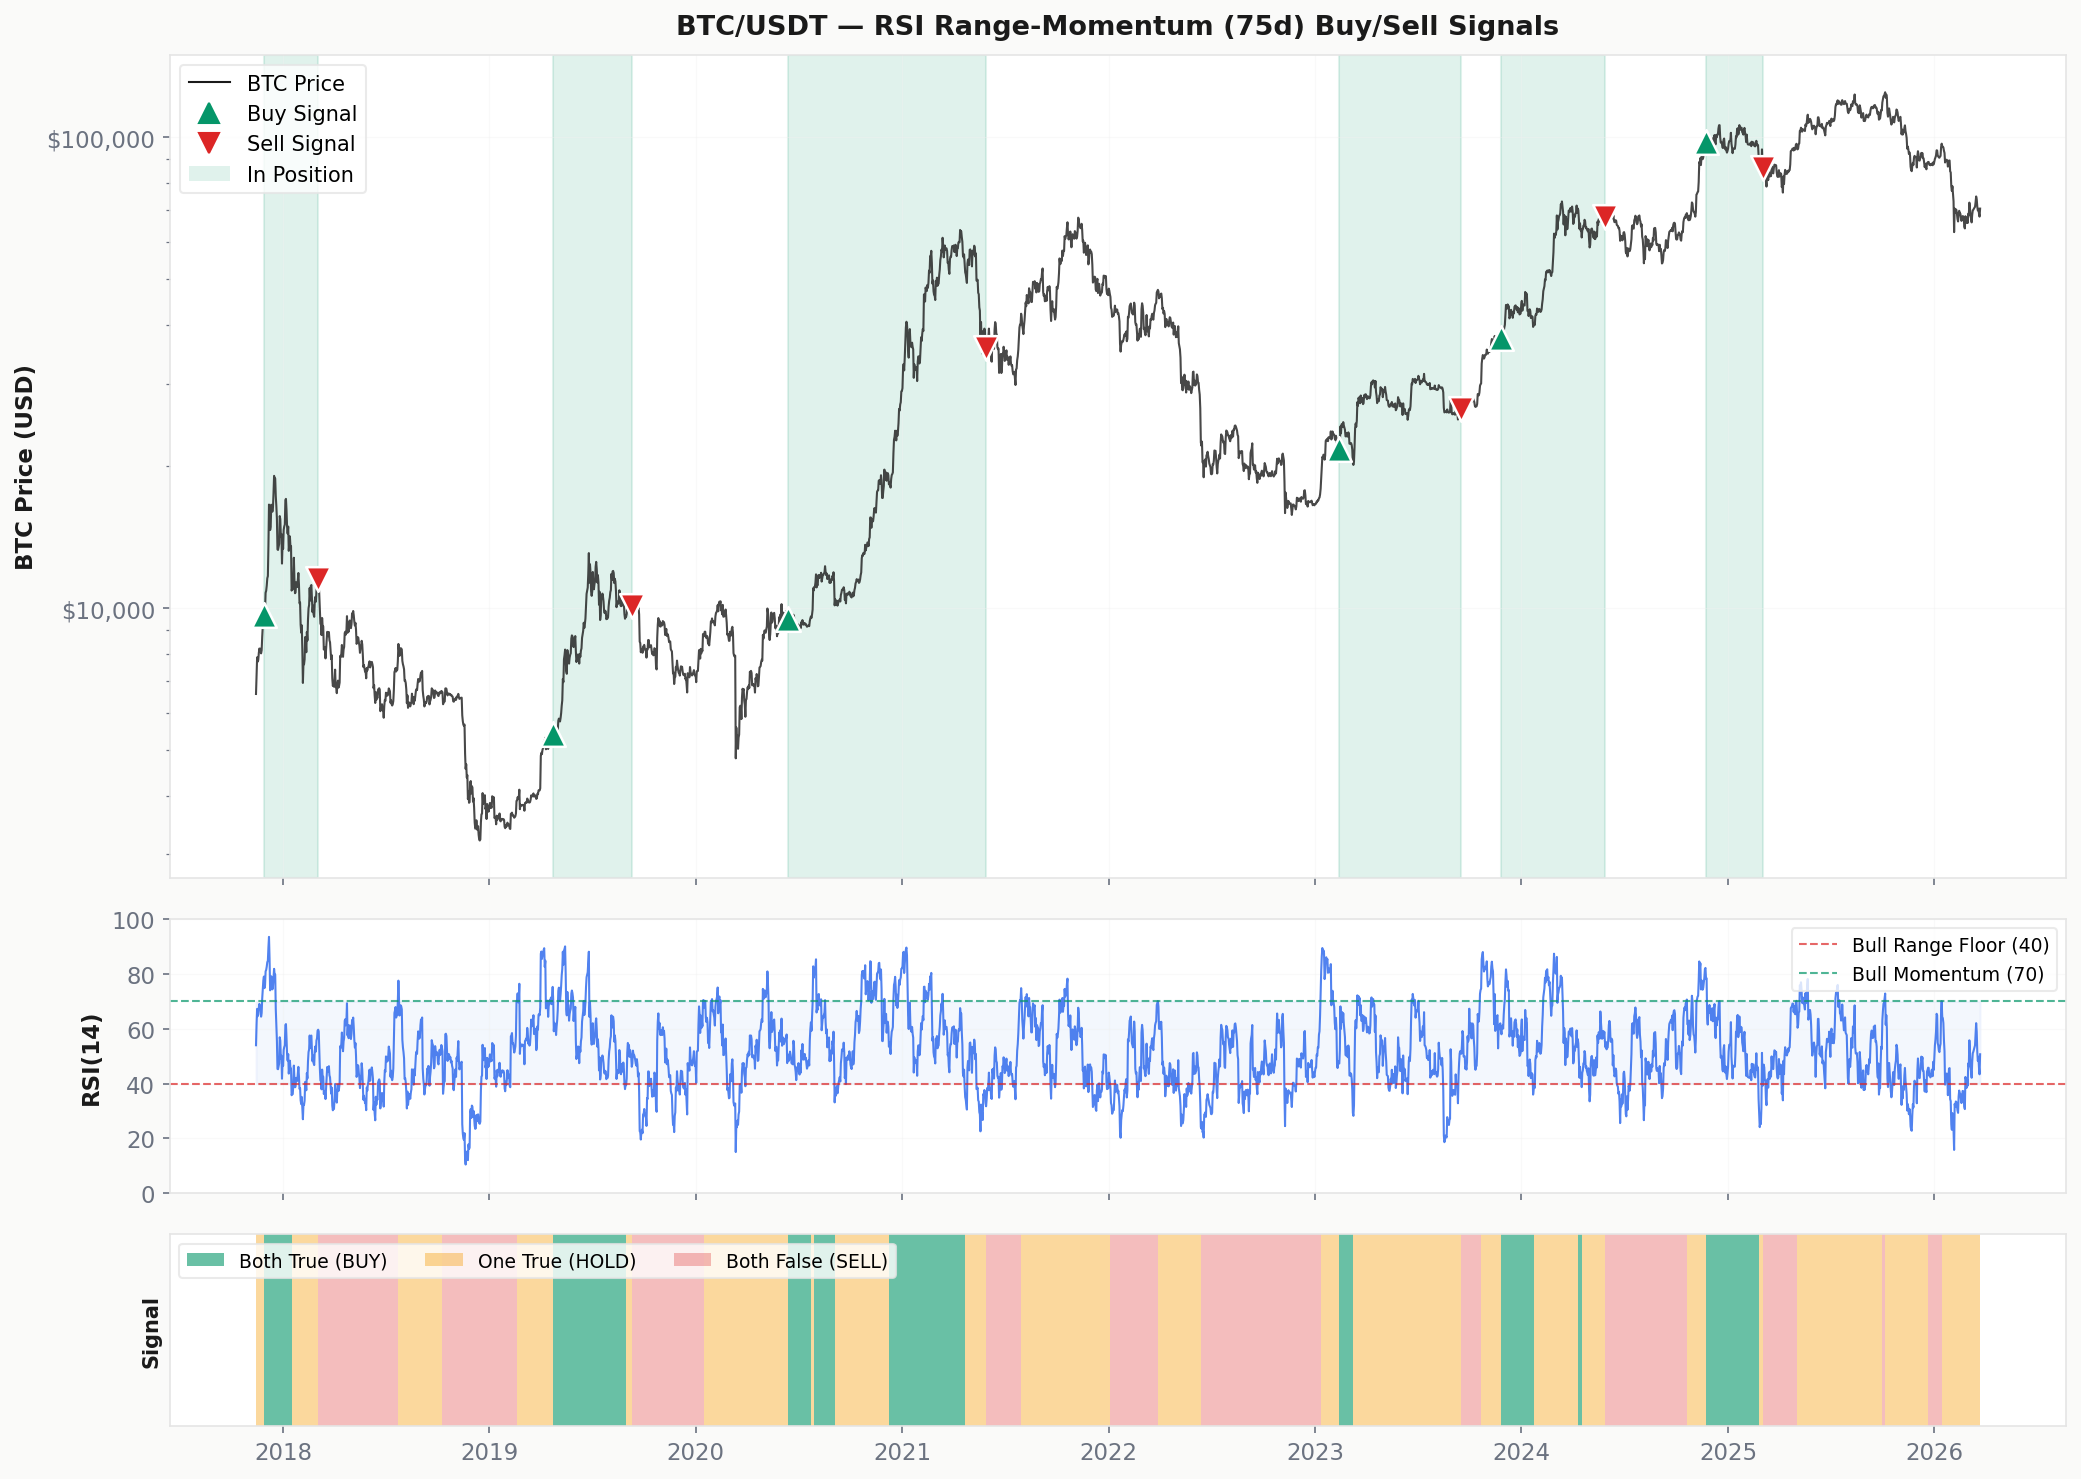
Signal Chart: Buy & Sell Points on BTC Price
The chart below shows every buy (green ▲) and sell (red ▼) signal generated by the strategy. Green shaded areas indicate periods when both conditions are met (in position). The middle panel shows RSI(14) with the Bull Range floor (40) and Bull Momentum threshold (70). The bottom bar shows the combined signal state: green = both true (buy), amber = one true (hold), red = both false (sell).
Backtest Results
Backtested on BTC/USDT daily data from Binance, 2017-11-14 to 2026-03-23 (8.4 years). Starting capital: $10,000. Transaction fees: 0.05% per side (maker order + slippage).
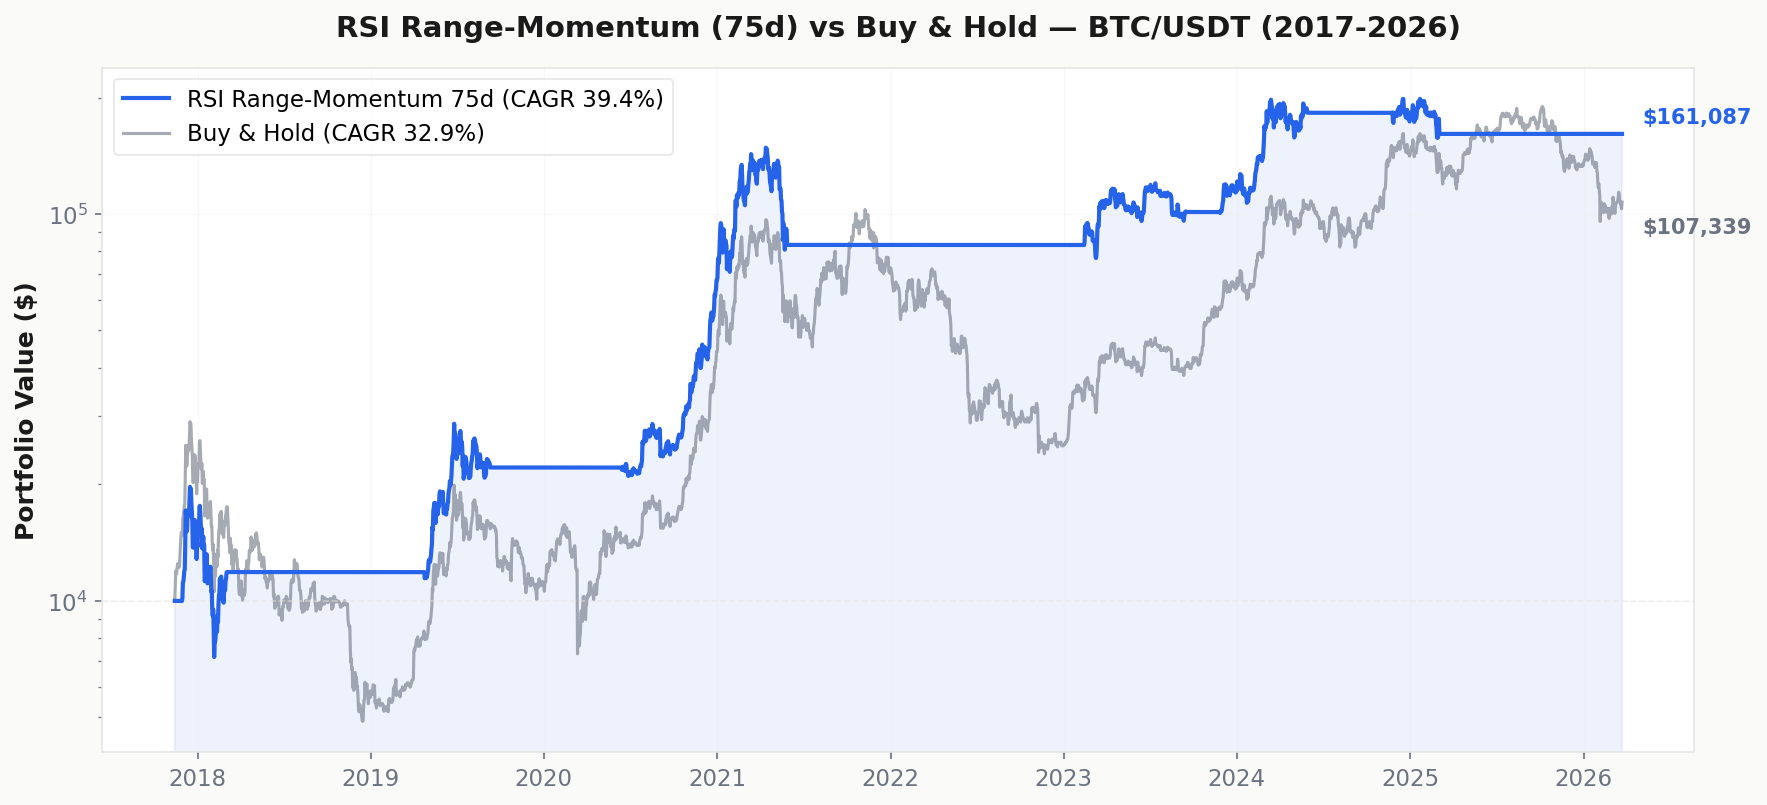
Performance Breakdown
The strategy beats Buy & Hold on both absolute CAGR (39.5% vs 32.9%) and risk-adjusted returns — while only being exposed to the market 35.6% of the time:
- Capital efficiency: Risk-adjusted return of 111.0%. The other % of the time, your capital is free — it could sit in stablecoins earning yield, or be deployed in uncorrelated strategies.
- Drawdown protection: Max drawdown of -63.7% vs -83.2%. In dollar terms on a $100,000 portfolio: strategy dips to $36,300 vs Buy & Hold dipping to $16,800.
- Win quality: W/L ratio of 8.3x. Average winning trade is +96.8%. The single losing trade was only -11.7%. The strategy catches big moves and cuts losses quickly.
Trade Analysis
With 6 trades over 8.4 years, 5 were winners. The strategy successfully captured every major Bitcoin bull run:
- Trade 3 (the monster): Entered June 2020 at $9,473 → exited May 2021 at $35,663 — a +276.5% return in 349 days. This single trade captured the heart of the 2020-2021 bull cycle.
- Trade 2: Caught the 2019 rally from $5,415 to $10,098 (+86.5% in 139 days).
- Trade 5: Captured the 2024 ETF-driven rally from $37,447 to $67,652 (+80.7% in 185 days).
- Trade 6 (the only loss): Entered November 2024 at $97,672 during the post-election rally, exited March 2025 at $86,221 for a modest -11.7% loss — the strategy correctly recognized the regime shift early.
Complete Trade Log
Why 75 Days? (Adapting for Bitcoin)
Arthur Hill’s original research used a 100-day lookback window for stocks (SPY). We tested multiple lookback periods on Bitcoin:
- 100 days (original): CAGR 9.8%, 5 trades, 40% win rate — too slow for crypto. The exit signal lags badly because it takes 100 days for high RSI readings to drop out of the window.
- 75 days (our choice): CAGR 39.5%, 6 trades, 83% win rate — the sweet spot. Responsive enough for crypto cycles, stable enough to avoid noise.
- 50 days: CAGR 30.8%, 13 trades, 69% win rate — more trades but lower CAGR due to more whipsaws.
Why does 75 work better? Bitcoin’s market cycles are faster than stocks. Bull-to-bear transitions that take 6+ months in equities can happen in 2-3 months in crypto. A shorter lookback window detects these regime shifts faster, exiting positions before catastrophic drawdowns. The 75-day window is a reasonable adaptation, not arbitrary optimization — it represents roughly one quarter, matching Bitcoin’s typical intra-cycle rhythm.
Important caveat: Adapting parameters after seeing results always carries overfitting risk. We’re transparent about this choice. The core logic (RSI range + momentum dual filter) is unchanged from the original research — only the lookback speed was adjusted for a faster asset class. See our backtesting pitfalls guide for more on this topic.
Why This Strategy Works (and When It Doesn’t)
Why it works: The dual-condition approach creates a high-confidence regime filter. By requiring both RSI floor stability (no panic selling) AND proven momentum (at least one strong rally), the strategy only enters during confirmed bullish regimes. This naturally avoids bear markets, ranging periods, and false breakouts.
When it doesn’t work:
- V-shaped recoveries: If Bitcoin crashes and bounces back faster than the lookback window can reset, the strategy misses the recovery.
- Late-cycle entries: Trade 6 entered near a local top. The strategy can’t distinguish “new bull market” from “final euphoria.”
- Low sample size: 6 trades is not enough for high statistical confidence. Treat this as a regime indicator, not a standalone system with proven edge.
How to Use This Strategy
We recommend RSI Range-Momentum as a capital allocation overlay:
- Both signals green: Allocate to Bitcoin — regime is confirmed bullish.
- Both signals red: Move to cash, stablecoins, or uncorrelated assets.
- Mixed signals: Hold current position without adding. Don’t force entries.
- Combine with faster strategies: Use this as a regime filter, then use RSI Trend Following (53.2% CAGR) or ADX (46.8% CAGR) for entry timing within confirmed regimes.
Check our Signal Dashboard for current RSI readings. Compare with other strategies: 200 SMA (simplest), MACD (42.5% CAGR), or Stochastic RSI (37.3% CAGR).
FAQ
Why not use the original 100-day lookback?
We tested it — it produces only 9.8% CAGR on Bitcoin with a 40% win rate. The 100-day window was designed for the stock market, where cycles move slower. Bitcoin’s regime changes happen faster, so the exit signal arrives too late with 100 days. The 75-day window detects bearish regime shifts about 3-4 weeks earlier, which makes a significant difference when Bitcoin can drop 30% in a month.
Can I combine this with other indicators?
Yes — and we’d recommend it. This strategy’s strength is regime identification, not entry timing. Consider using RSI Range-Momentum to decide whether to be in Bitcoin, then use a momentum indicator like MACD or ADX to decide when to enter and exit within that regime. This two-layer approach can potentially improve both win rate and risk management.
Is 6 trades enough to trust this strategy?
No — and we’re upfront about that. Six trades gives you a directional indication, not statistical certainty. The strategy’s value is more conceptual: RSI range analysis is a legitimate way to identify market regimes, and the backtested results are consistent with this thesis. But you should never bet your portfolio on any strategy with only 6 data points. Combine it with other confirmed approaches.
Past performance does not guarantee future results. Backtesting has inherent limitations — especially with optimized parameters. See our backtesting pitfalls guide for important caveats. Understand the metrics: Backtest Metrics Decoded.
 EN
EN 日本語
日本語 Español
 Português
 العربية
 繁體中文
繁體中文 简体中文
简体中文