Bitcoin Supertrend Strategy Backtest — ATR Trend Following (2017-2026)
The Supertrend indicator is a popular trend-following tool that uses ATR (Average True Range) to create dynamic support/resistance bands around price. When price crosses above the band, the trend flips bullish; when it crosses below, the trend flips bearish. We backtested the classic Supertrend (ATR=10, multiplier=3.0) on Bitcoin over 8.6 years of real Binance data. The result: CAGR of 33.0% with -61.5% max drawdown — slightly underperforming Buy & Hold’s 37.6% CAGR, but with significantly less drawdown (-83.2% for B&H) and only being in the market 49.5% of the time.
Key Takeaways
- Supertrend generates CAGR 33.0% vs Buy & Hold 37.6% — slightly trails in raw return
- Maximum drawdown: -61.5% vs Buy & Hold -83.2% — 22 points less pain
- Total return: +1,054% ($10k → $115k) vs Buy & Hold +1,436%
- 38 trades in 8.6 years (about 4-5 per year)
- Win rate: 42.1% — classic trend following: lose often, win big
- Win/Loss ratio: 4.1x — average win +42.3% vs average loss -10.3%
- Time in market: 49.5% — roughly half the time in cash
- Risk-adjusted return: 66.8% (CAGR ÷ time in market)
What Is Supertrend?
The Supertrend indicator was developed by Olivier Seban. It plots a single line above or below price based on the ATR (Average True Range) — a measure of volatility. Think of it as a trailing stop that automatically adjusts to market conditions:
- In an uptrend: Supertrend plots below price as support. It only moves up, never down (ratcheting mechanism)
- In a downtrend: Supertrend plots above price as resistance. It only moves down, never up
- Direction flip: When price crosses the Supertrend line, the direction reverses — this is your trade signal
The calculation: Upper Band = (High + Low)/2 + Multiplier × ATR. Lower Band = (High + Low)/2 – Multiplier × ATR. The bands ratchet (only move in trend direction), and the active band depends on whether the trend is currently bullish or bearish.
Strategy Rules
Parameters:
- ATR Period: 10 days
- Multiplier: 3.0
- Asset: BTC/USDT (Binance daily candles)
- Position: 100% long or 100% cash
- Transaction fee: 0.05% per side (0.1% round trip)
Buy Signal: Supertrend direction flips from bearish (-1) to bullish (+1) — price has crossed above the upper band.
Sell Signal: Supertrend direction flips from bullish (+1) to bearish (-1) — price has crossed below the lower band.
Key property: The multiplier of 3.0 means the band is placed 3× the ATR away from the median price. This creates wide bands that filter out normal volatility and only signal when a genuine trend change occurs. Lower multipliers (like 1.5-2.0) would generate more trades but more false signals.
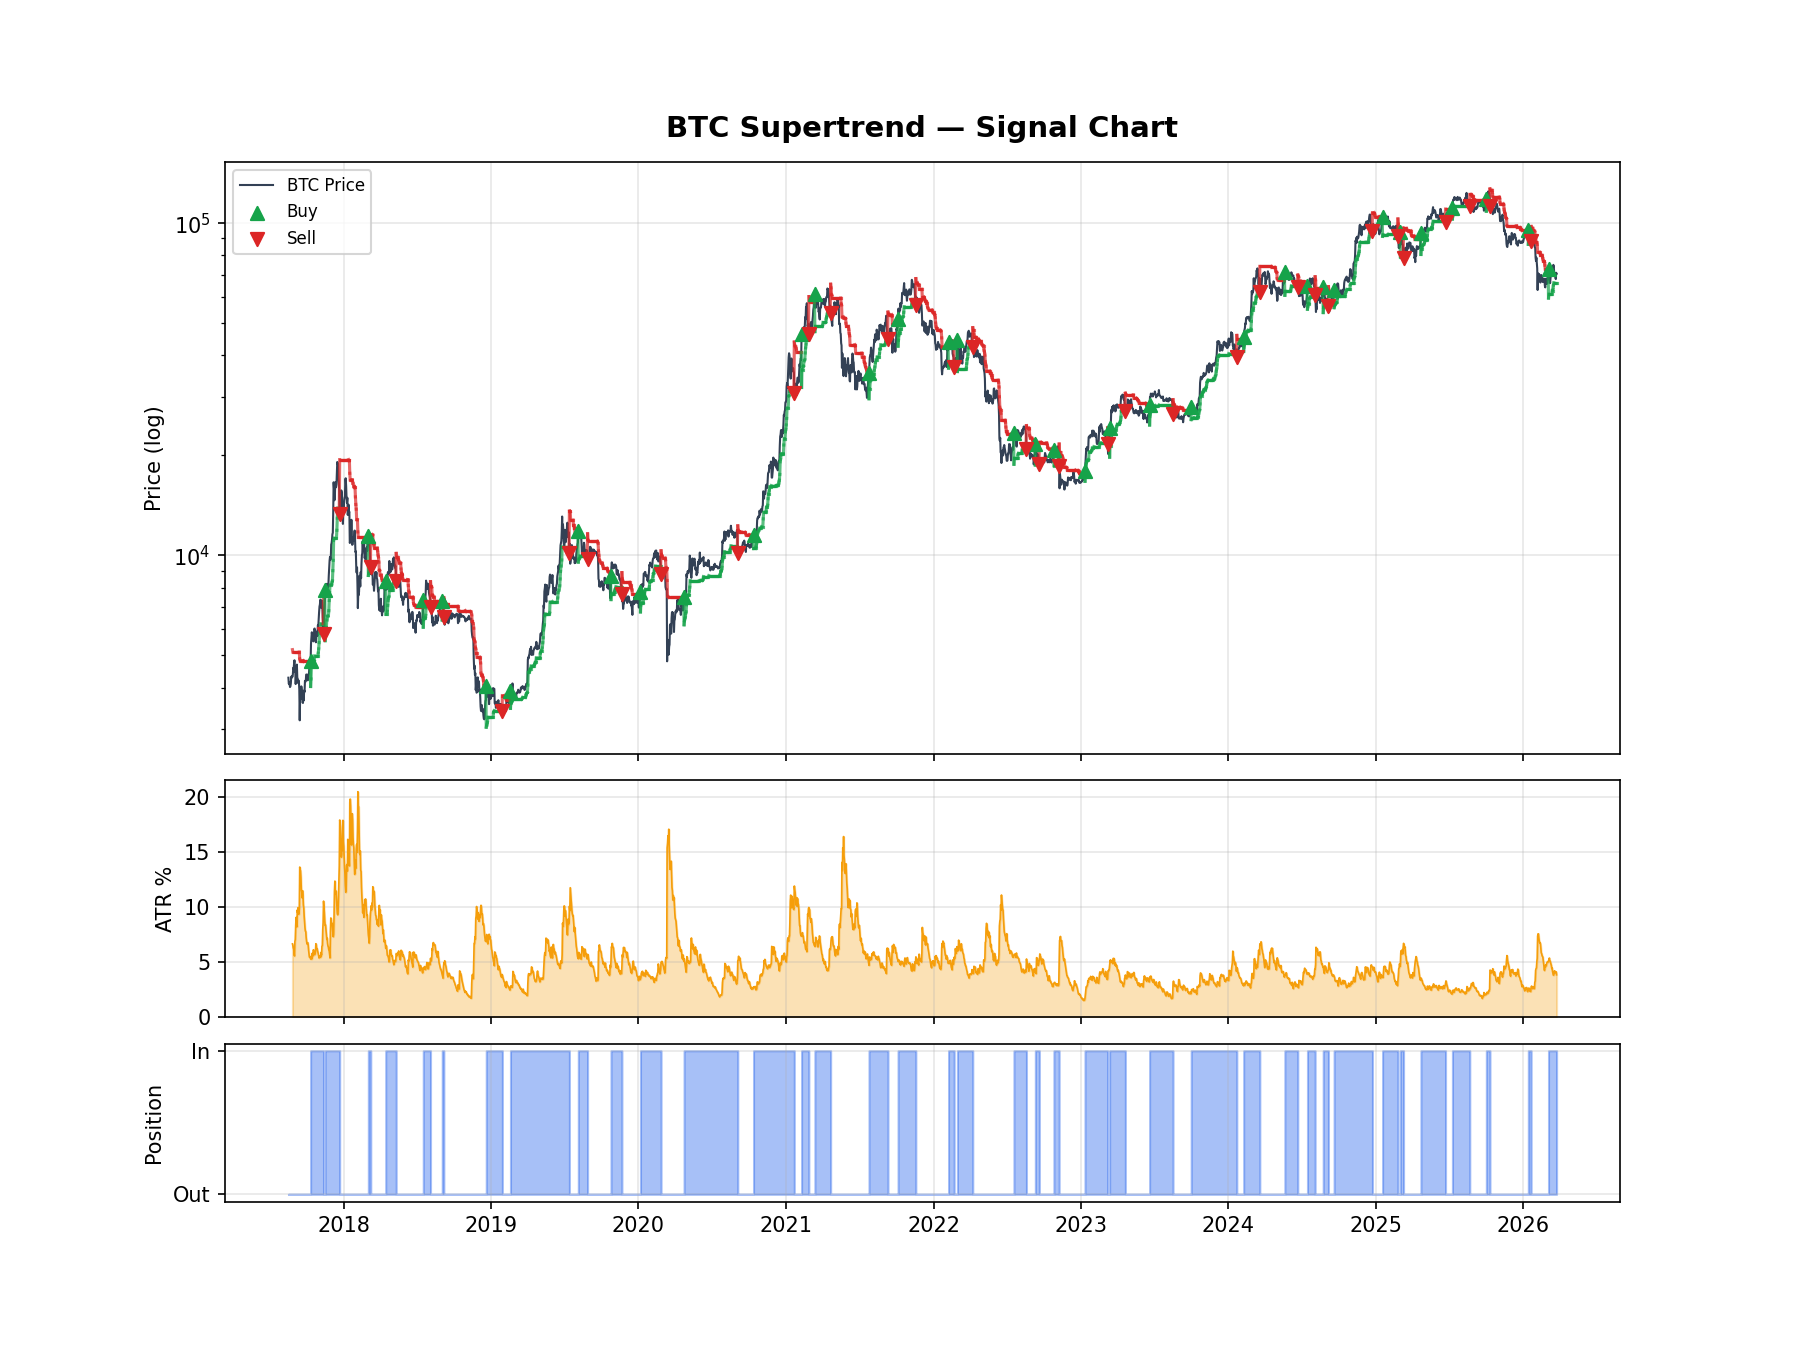
Signal Chart: Buy & Sell Points on BTC Price
The chart below shows every buy (green ▲) and sell (red ▼) signal. The Supertrend line itself is colored green (bullish) or red (bearish). The middle panel shows ATR as a percentage of price (higher = more volatile). The bottom bar shows position state.
Backtest Results
Period: August 2017 – March 2026 (8.6 years). Starting capital: $10,000. Fees: 0.05% per side.
Equity Curve: Strategy vs Buy & Hold
The equity curve shows the strategy slightly trailing Buy & Hold in total return. However, notice the much smoother ride — the strategy avoids the worst of the 2018 and 2022 bear markets.
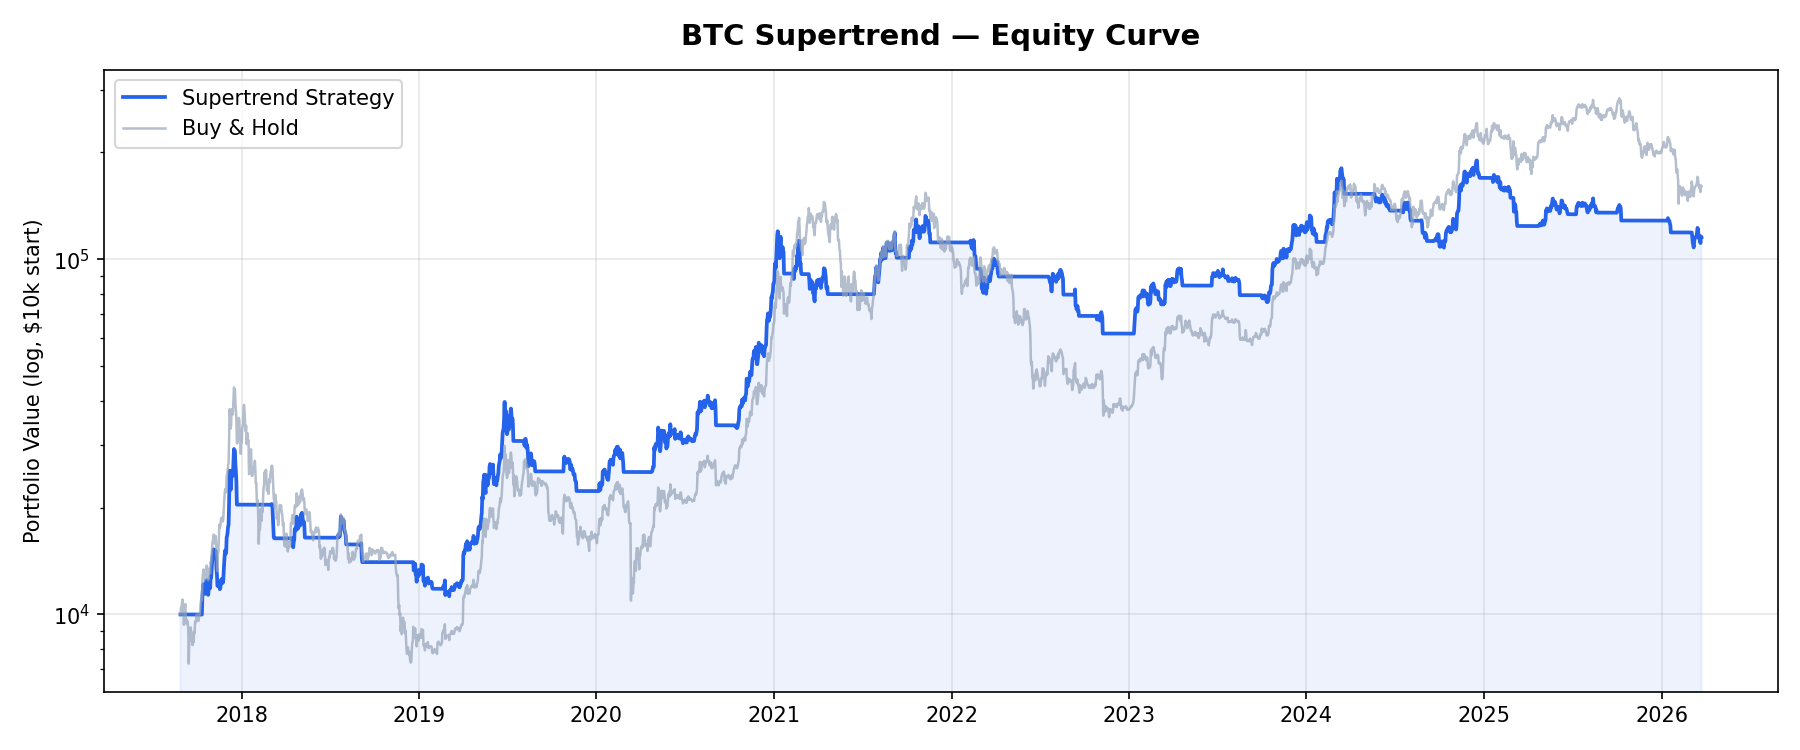
Key observations:
- 2019 rally: The best single trade — +161% from Feb to Jul 2019 — caught the recovery from the 2018 crash bottom
- 2020-2021 bull run: Captured +167.6% (Oct 2020 → Jan 2021) but got shaken out before the $60k+ top, causing missed gains
- 2022 bear market: Exited early and took several small losses from false signals, but avoided the worst of the crash
- 2024 bull run: Caught the major +50.7% move (Sep → Dec 2024)
Trade Analysis
38 trades over 8.6 years — very manageable at about 4-5 trades per year. The Supertrend indicator acts as a trailing stop, so entries and exits are mechanical.
The main weakness: the 3.0 multiplier creates wide bands, which means you enter late into trends and exit late out of them. The 2021 bull run illustrates this — the strategy got whipsawed around the $45k-$60k range, entering and exiting three times in the $46-62k zone. This cost significant returns compared to strategies like Donchian that use tighter exits.
Best trade: February → July 2019, +161.0% in 146 days. Worst trade: March 2018, -19.5% in just 6 days (a sharp reversal that triggered the exit quickly).
Why Supertrend Slightly Underperforms Buy & Hold
The 4.6% CAGR gap versus Buy & Hold comes from two sources:
- Late entries on rallies: The 3× ATR buffer means you enter well after the trend starts. In explosive BTC moves, this can mean missing 10-20% of the initial surge
- Whipsaws in 2021: Three consecutive trades around $45k-$60k all resulted in small losses or break-even, costing compound returns during what was actually a bull market
However, the strategy still has value: -61.5% max drawdown vs -83.2% means you sleep much better at night, and the 49.5% time in market means half your capital is available for other opportunities.
Comparing to Other Strategies
- Donchian Breakout (Turtle): 48.2% CAGR — significantly better due to tighter exits
- RSI Trend Following: 53.2% CAGR — highest performer but much more active (182 trades)
- RSI Range-Momentum: 39.5% CAGR — fewer trades, better risk-adjusted
- 200 SMA: 26.1% CAGR — simpler but lower returns
- Supertrend: 33.0% CAGR — middle of the pack, with decent drawdown protection
Complete Trade Log
Every trade executed by the strategy. ✓ = winning, ✗ = losing.
FAQ
If Supertrend underperforms Buy & Hold, why use it?
The 4.6% CAGR gap comes with a 22-point drawdown improvement (-61.5% vs -83.2%). For most people, losing 83% of their portfolio is psychologically devastating — it makes you sell at the worst time. Supertrend keeps losses manageable and frees up capital 50% of the time.
Would a smaller multiplier work better?
A smaller multiplier (e.g., 2.0) would generate more trades and tighter stops. This could improve returns in trending markets but would also increase whipsaws in choppy markets. The 3.0 multiplier is the widely-used default precisely because it balances sensitivity with noise filtering.
Methodology
This backtest uses real BTC/USDT daily candle data from Binance (August 2017 – March 2026). We apply a 0.05% fee per trade side (0.1% round trip) to simulate realistic maker orders with slippage. The strategy goes 100% long or 100% cash — no leverage, no short selling. Past performance does not guarantee future results.
Disclaimer: This is educational content based on historical data. It is not financial advice. Cryptocurrency markets are highly volatile. Always do your own research before trading.
 日本語
日本語 Español
 Português
 العربية
 繁體中文
繁體中文 简体中文
简体中文