Bitcoin Williams %R Mean Reversion Backtest — Why Dip Buying Fails (2017-2026)
Williams %R is a momentum oscillator that measures overbought/oversold conditions. The mean reversion approach — buying when %R drops below -90 (extreme oversold) and selling when price recovers — works well on stocks and ETFs. But how does it perform on Bitcoin? We tested a 2-period Williams %R mean reversion strategy on 8.6 years of BTC data. The verdict: CAGR of -0.6% — a complete failure. This is another data point confirming that mean reversion strategies consistently fail on Bitcoin.
Key Takeaways
- Williams %R Mean Reversion generates CAGR -0.6% vs Buy & Hold 39.3% — strategy catastrophically fails
- Total return: -5.2% ($10k → $9.5k) vs Buy & Hold +1,624% — you literally lost money
- 119 trades in 8.6 years — very active (14 trades/year)
- Win rate: 66.4% — you win 2 out of 3 trades, yet still lose overall
- Win/Loss ratio: 0.6x — average win +3.7% is dwarfed by average loss -6.4%
- Time in market: 13.3% — only invested ~7 weeks per year
- Maximum drawdown: -58.8% — still horrific despite being mostly in cash
What Is Williams %R?
Williams %R was developed by Larry Williams in 1966. It measures where the current close sits relative to the high-low range over a given period:
Williams %R = (Highest High – Close) / (Highest High – Lowest Low) × -100
The indicator oscillates between 0 and -100. Readings below -80 are considered oversold; above -20 are overbought. With a very short period (2 days), the indicator becomes extremely sensitive — perfect for catching short-term mean reversion bounces.
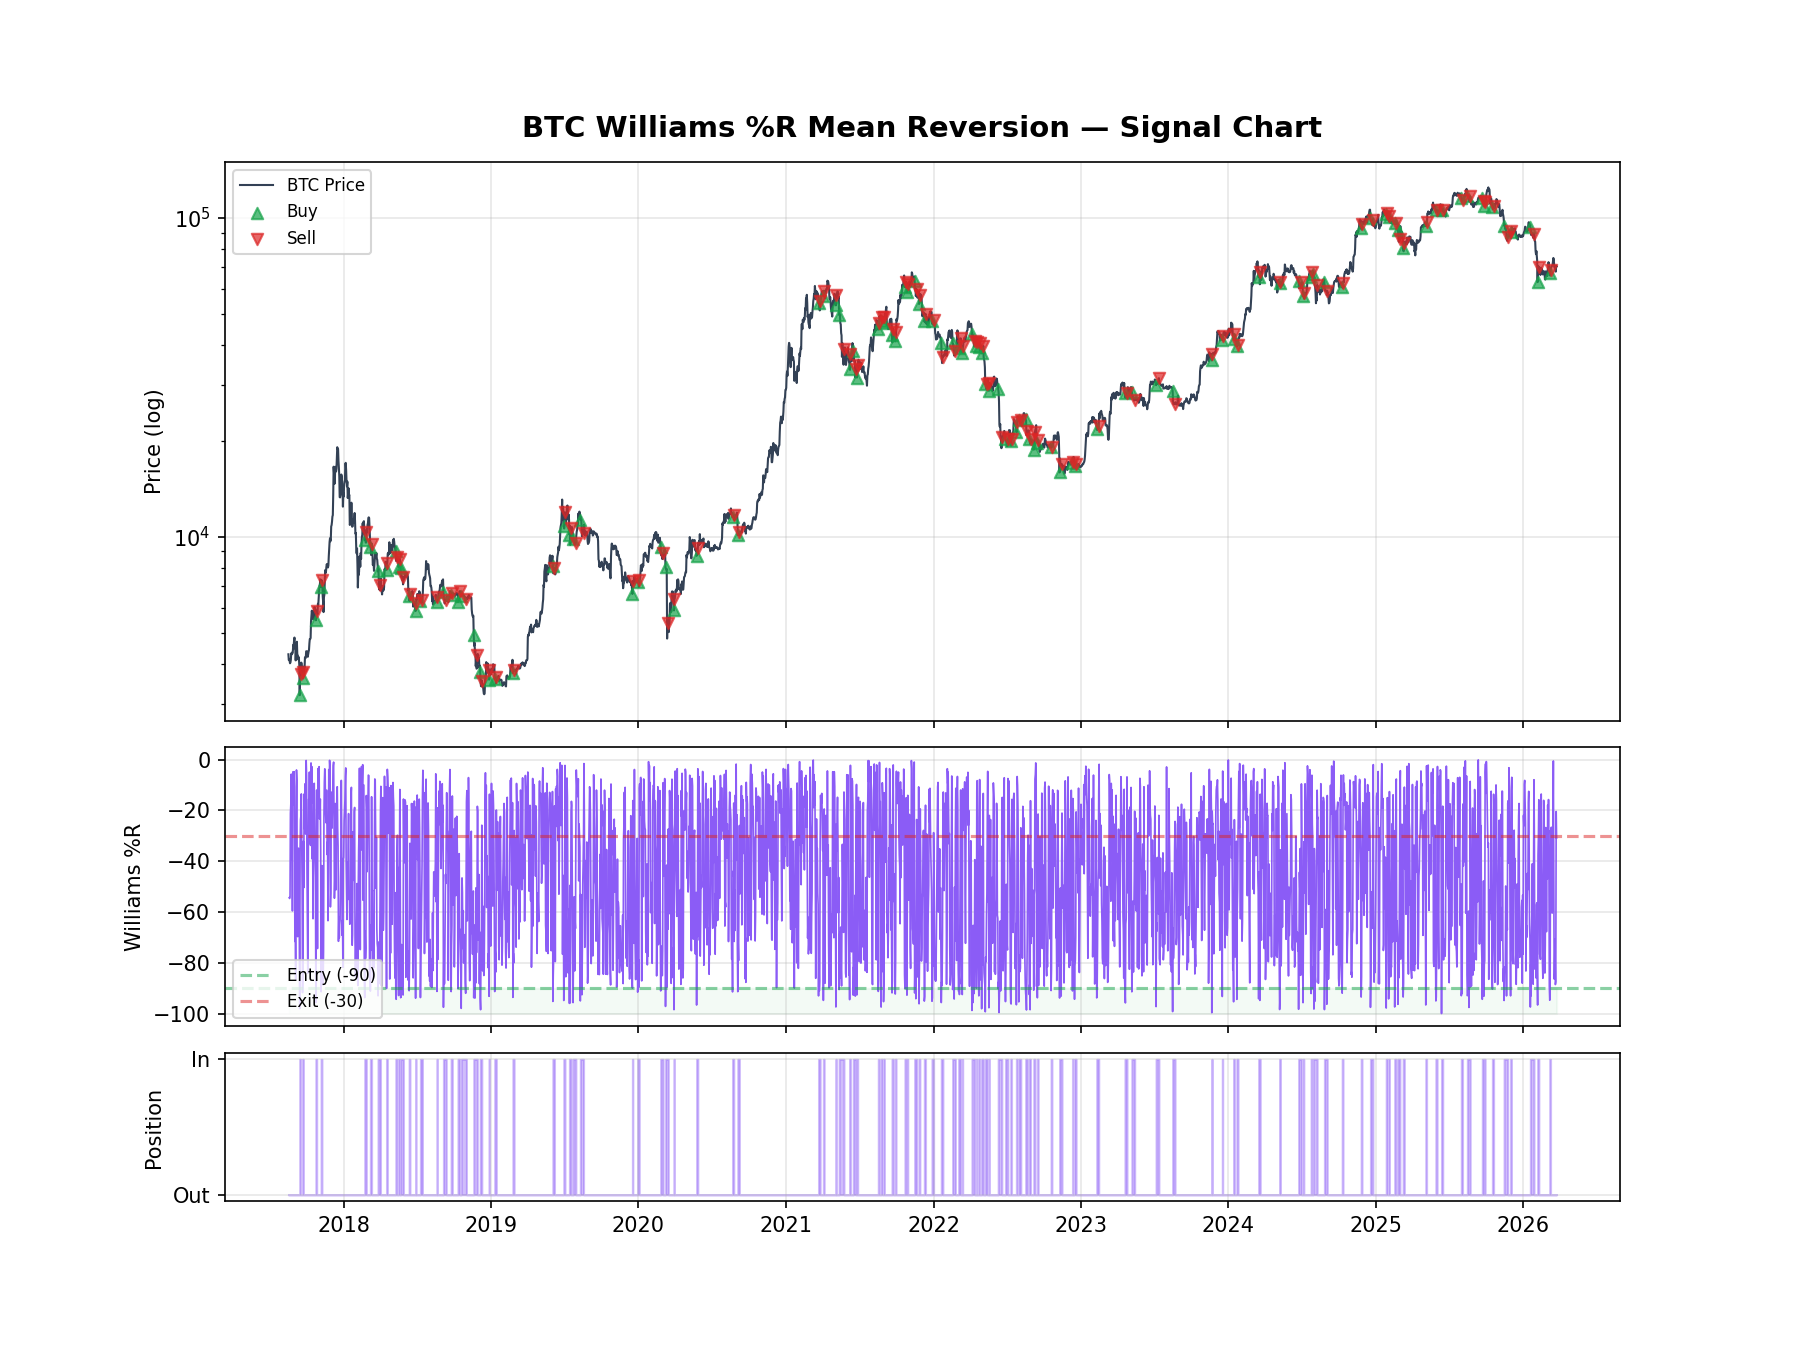
Strategy Rules
- Williams %R Period: 2 days (ultra short-term)
- Entry: Williams %R drops below -90 (extreme oversold)
- Exit: Either close > previous day’s high, OR Williams %R rises above -30
- Asset: BTC/USDT (Binance daily candles)
- Position: 100% long or 100% cash
- Transaction fee: 0.05% per side (0.1% round trip)
The logic: when Williams %R plunges below -90, the price has dropped sharply relative to its recent range. The strategy buys this dip and exits when either the price bounces back above the previous day’s high, or the indicator itself recovers to a neutral zone (-30).
Signal Chart: Buy & Sell Points on BTC Price
Backtest Results
Period: August 2017 – March 2026 (8.6 years). Starting capital: $10,000. Fees: 0.05% per side.
Equity Curve: Strategy vs Buy & Hold
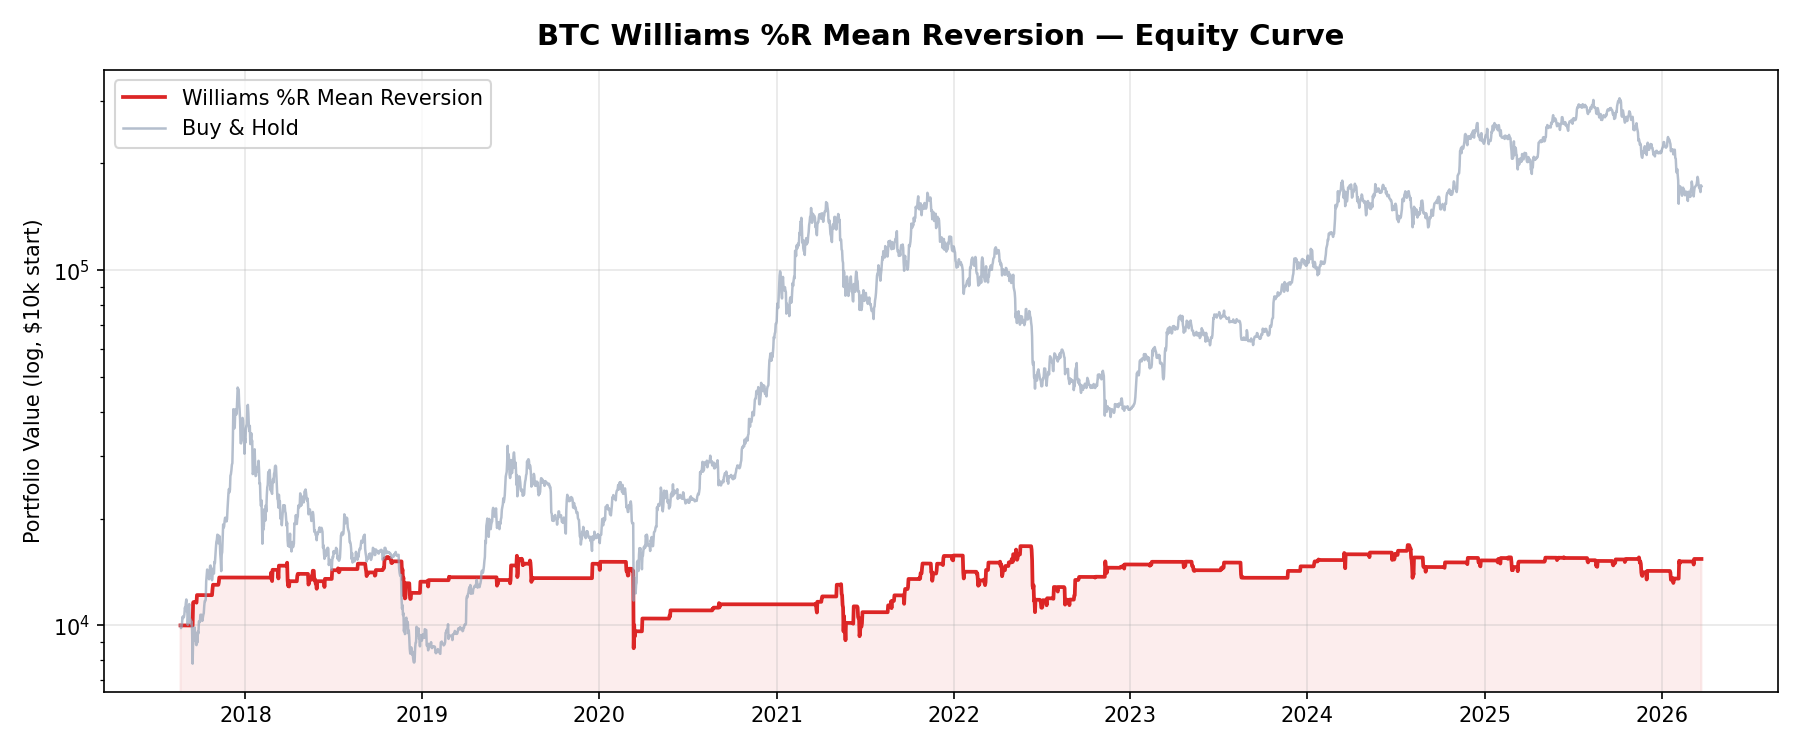
The equity curve says it all. Buy & Hold (gray) grows from $10k to $170k+. The Williams %R strategy (red) goes nowhere — ending below where it started. The strategy actually performed decently in 2017-2018 when BTC was choppier, but every subsequent recovery attempt was erased by larger losses during bear market dips.
Why Williams %R Fails on Bitcoin
This is the same story we’ve seen with every mean reversion strategy on Bitcoin:
- Dips don’t bounce — they crash. On stocks, a 2-day dip usually bounces because market makers and institutions provide liquidity. On Bitcoin, a 2-day dip often becomes a 30-60% crash because of cascading liquidations, panic selling, and thin order books
- High win rate, terrible risk/reward. 66% win rate sounds great — but average win (+3.7%) is half the average loss (-6.4%). The losing third of trades wipes out all the winners and then some
- You catch falling knives. Every major crash (2018, 2020, 2022) triggered buy signals on the way down. The strategy bought at -90 and watched it go to -100 and stay there
- Missing the bull runs. With only 13.3% time in market, you’re mostly in cash during Bitcoin’s explosive rallies. You catch tiny bounces while missing multi-month trends
Mean Reversion vs Trend Following on Bitcoin
Across all 15 strategies we’ve backtested, the pattern is unambiguous:
- Trend following strategies that work: Donchian Breakout 48.2%, RSI Trend Following 53.2%, RSI Range-Momentum 39.5%, ADX 46.8%, MACD 42.5%
- Mean reversion strategies that fail: Williams %R -0.6%, RSI Mean Reversion -5.3%, Bollinger Bands -4.6%
The lesson: Bitcoin is a trending asset. Don’t buy dips based on technical indicators — ride trends instead. If you want to buy dips, use fundamental analysis (on-chain metrics, macro conditions) rather than short-term oscillators.
FAQ
Would different Williams %R parameters help?
Unlikely. The problem isn’t the parameters — it’s the strategy type. Mean reversion assumes prices oscillate around a mean. Bitcoin doesn’t do that; it trends for months at a time. Tweaking the period from 2 to 5 or 10 might change the numbers slightly, but the fundamental mismatch remains.
Does Williams %R work for stocks?
Research by Larry Connors and others shows 2-period mean reversion works well on S&P 500 stocks and ETFs, particularly SPY. The difference is market structure: stocks have mean-reverting behavior due to institutional buying on dips, while crypto is driven by momentum and narrative.
Methodology
This backtest uses real BTC/USDT daily candle data from Binance (August 2017 – March 2026). We apply a 0.05% fee per trade side (0.1% round trip). The strategy goes 100% long or 100% cash. Past performance does not guarantee future results.
Disclaimer: This is educational content based on historical data. It is not financial advice. Cryptocurrency markets are highly volatile. Always do your own research before trading.
 日本語
日本語 Español
 Português
 العربية
 繁體中文
繁體中文 简体中文
简体中文