SPX Surged 2.85% and the Next Day Was Green Too — This Only Happens 53% of the Time
Blog 1 showed that a >2.85% day leads to below-average forward returns. But what if the very next day is also green? That changes everything. Here’s what 80 historical instances tell us.
The Follow-Up Question
In our previous analysis, we found that SPX gaining >2.85% in a single day is not a bullish signal. The average next-day return is -0.14%, and forward returns underperform at every time horizon.
But on March 31, 2026, SPX surged +2.91% — and then on April 1, it went up again.
This raised a question: Does a green follow-through day change the statistical picture?
The answer is yes. Dramatically.
The Split: 80 vs 72
Since 1950, there have been 152 instances of SPX gaining >2.85% in a single session. The next day:
- 80 times (53%) — the next day was also positive
- 72 times (47%) — the next day was negative
It’s almost a coin flip. But the forward returns from these two groups are worlds apart.
Two Completely Different Outcomes
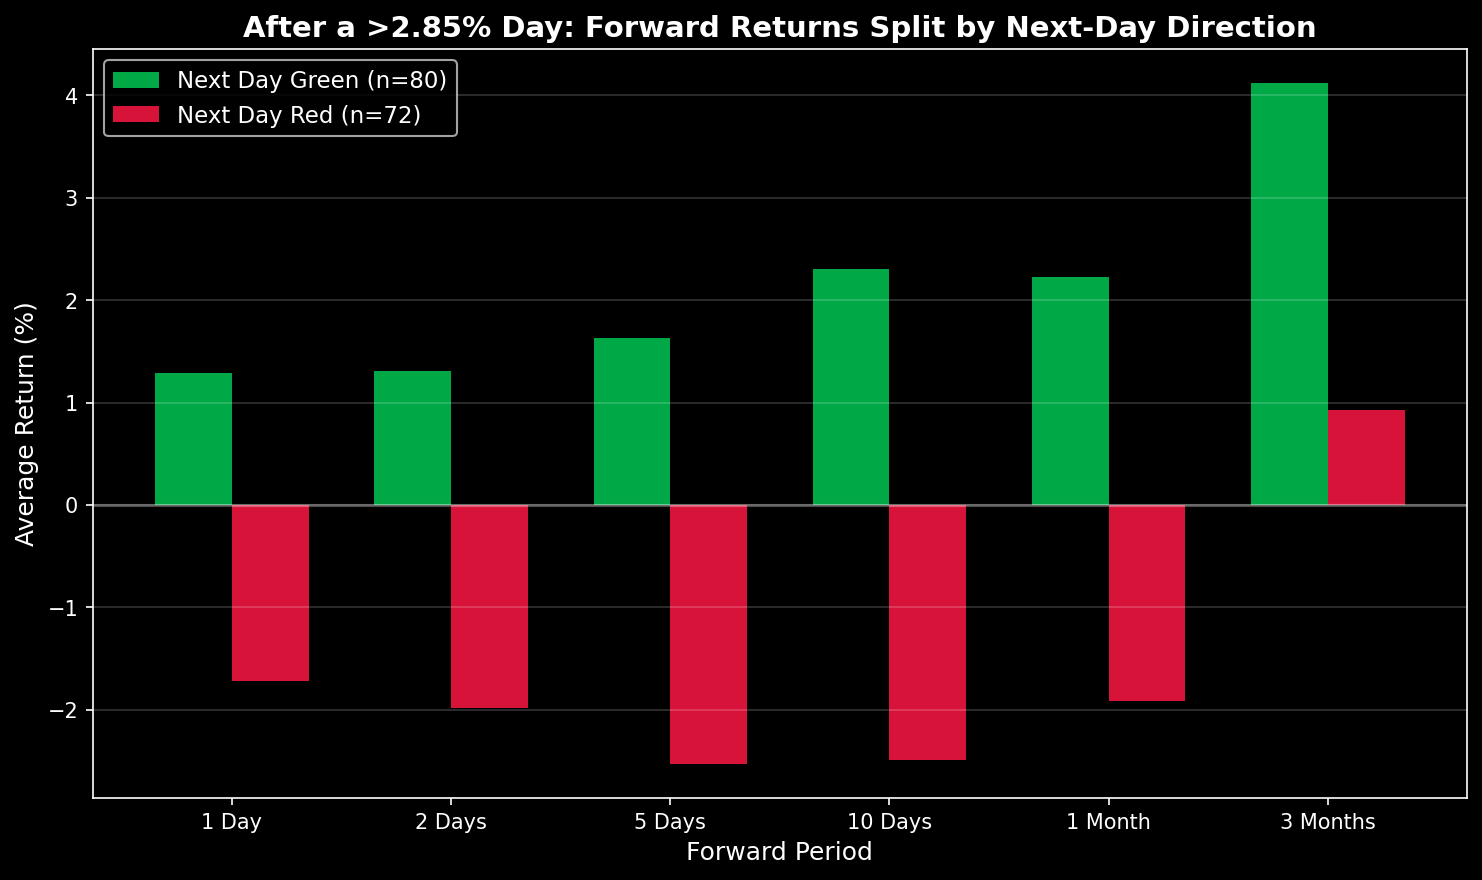
| Period | Next Day Green (n=80) | Next Day Red (n=72) | Difference |
|---|---|---|---|
| 1 Day | +1.29% (WR 100%) | -1.72% (WR 0%) | +3.01% |
| 2 Days | +1.31% (WR 78%) | -1.98% (WR 22%) | +3.29% |
| 5 Days | +1.63% (WR 76%) | -2.53% (WR 38%) | +4.16% |
| 10 Days | +2.30% (WR 72%) | -2.49% (WR 38%) | +4.79% |
| 1 Month | +2.23% (WR 66%) | -1.91% (WR 46%) | +4.14% |
| 3 Months | +4.12% (WR 71%) | +0.93% (WR 54%) | +3.19% |
Look at the 5-day numbers: +1.63% vs -2.53%. That’s a 4.16 percentage point gap based on a single binary signal — whether the next day was green or red.
At 10 days, the green group averages +2.30% with a 72% win rate. The red group averages -2.49% with only a 38% win rate. Same starting condition (big up day), completely different trajectories.
Win Rates Tell the Same Story
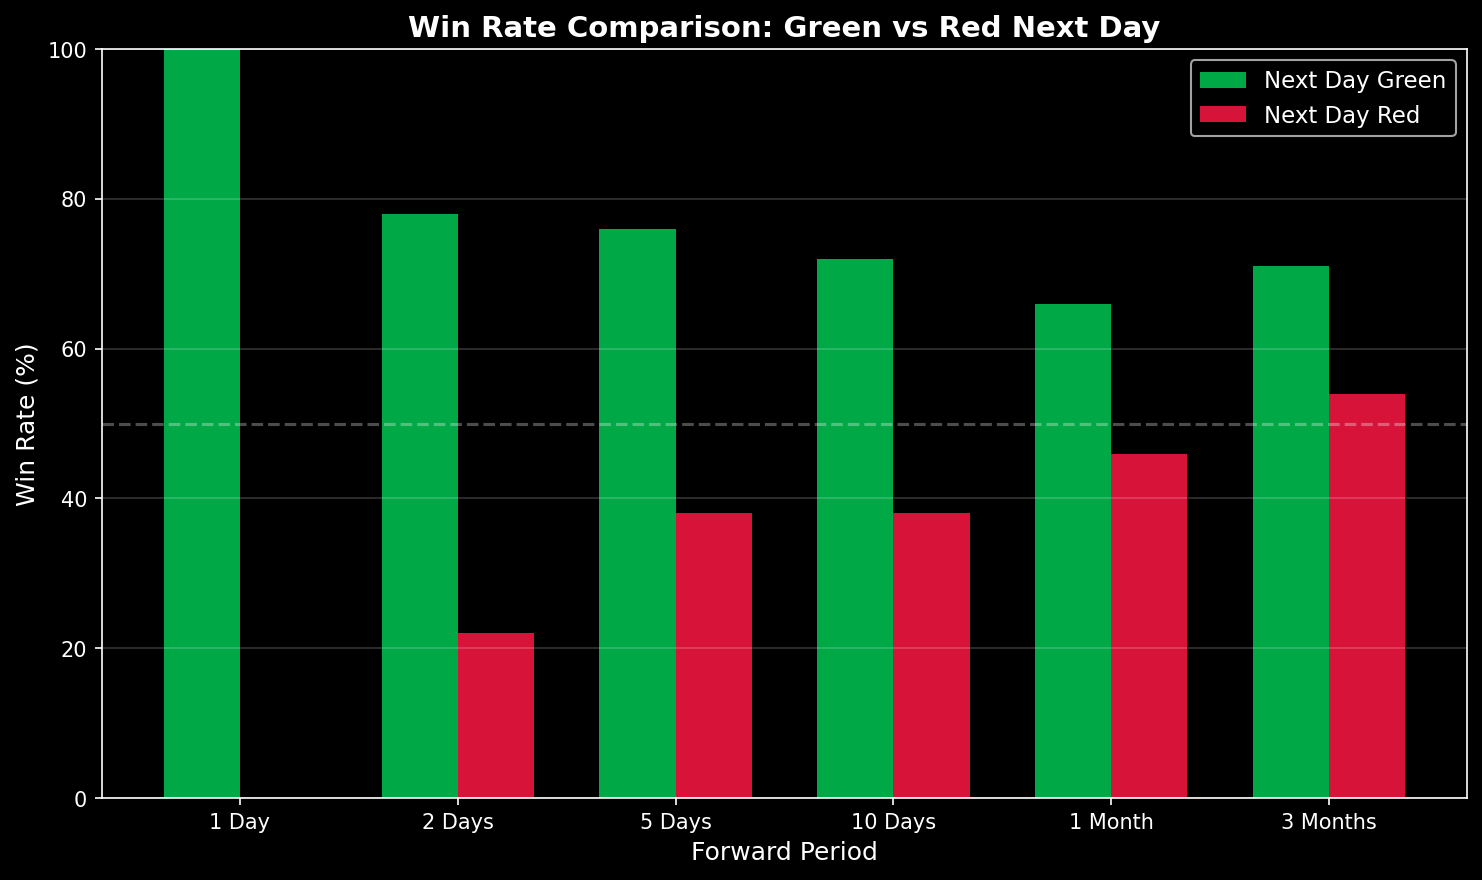
The green group maintains a 66-76% win rate across all horizons. The red group sits at 22-54% — consistently below a coin flip at short to medium timeframes.
This is the key insight: the next day’s direction after a big up day is a genuine signal, not noise.
But What If You Bought After Seeing the Green Day?
There’s a practical problem. You can only know the next day was green after it closes. So if you use this as a signal, your entry is Day 1’s close — not the big up day’s close.
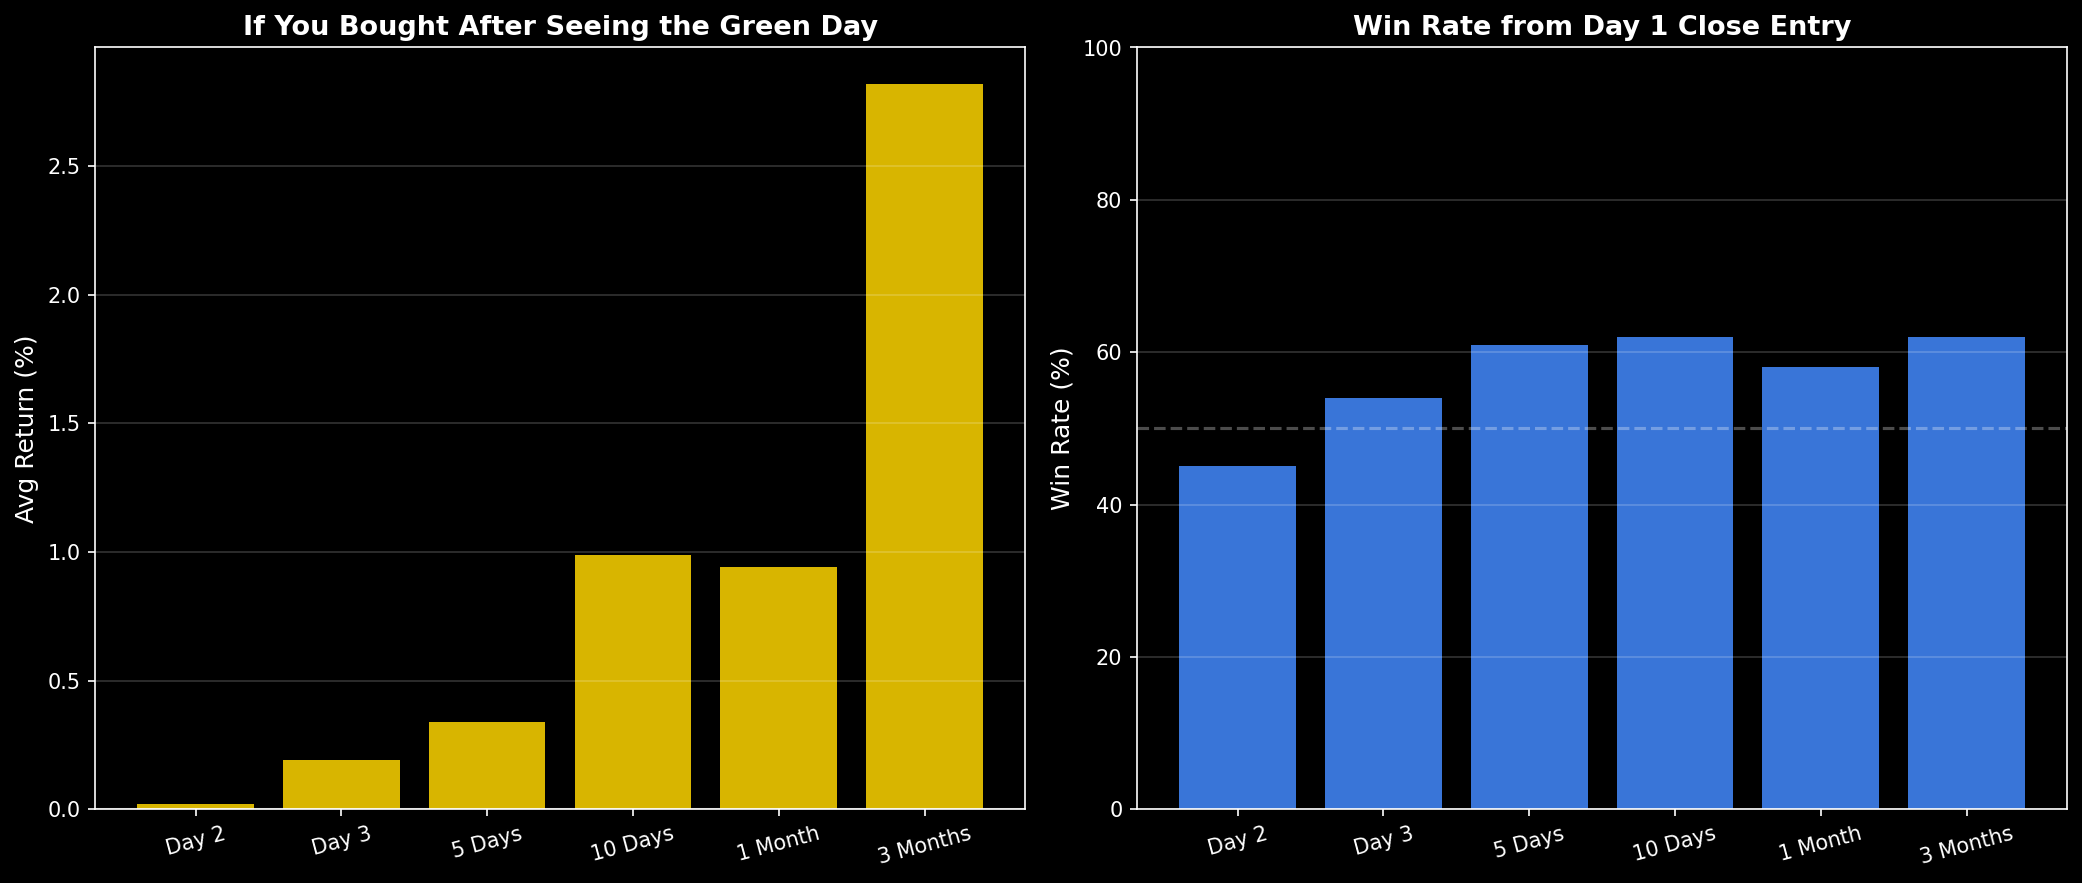
| Period (from Day 1 close) | Avg Return | Win Rate |
|---|---|---|
| Day 2 | +0.02% | 45% |
| Day 3 | +0.19% | 54% |
| 5 Days | +0.34% | 61% |
| 10 Days | +0.99% | 62% |
| 1 Month | +0.94% | 58% |
| 3 Months | +2.82% | 62% |
The returns are positive but modest. Day 2 is essentially a coin flip (45% WR). The edge builds slowly — by 3 months, you’re looking at +2.82% with a 62% win rate.
Translation: The confirmation signal is real, but most of the alpha was captured in the original big up day + follow-through. By the time you confirm the signal and enter, you’re buying the tail end of the initial momentum.
What This Means for March 31, 2026
SPX surged +2.91% on March 31, then gained +0.72% on April 1. This puts us in the “green next day” camp — the historically favorable group.
Based on the 80 prior instances in this group:
- 5-day outlook: +1.63% avg, 76% win rate
- 10-day outlook: +2.30% avg, 72% win rate
- 1-month outlook: +2.23% avg, 66% win rate
- 3-month outlook: +4.12% avg, 71% win rate
Compare this to the overall >2.85% day numbers from our previous article (which included both green and red next days): the all-event averages were -0.36% at 5 days and +0.26% at 1 month. The green-follow-through group outperforms at every horizon.
Notable Historical Instances
Some of the most famous green-follow-through events:
- 2020-03-24 (Post-COVID crash): Big up +9.4%, next day +1.2% → 1-month: +14.3%
- 2019-01-04 (Post-Christmas): Big up +3.4%, next day +0.7% → 1-month: +8.1%
- 2018-12-26 (Christmas bottom): Big up +5.0%, next day +0.9% → 1-month: +7.1%
- 2025-05-12: Big up +3.3%, next day +0.7% → 1-month: +3.0%
- 2011-11-28: Big up +2.9%, next day +0.2% → 1-month: +4.8%
These aren’t cherry-picked — the group average is genuinely positive. However, note that some instances still led to losses at 1 month (34% of the time). This is a probability tilt, not a guarantee.
Why the Next Day Matters
A big up day by itself is ambiguous. It could be:
- A dead cat bounce in a bear market — sharp relief rally that immediately reverses.
- A genuine inflection point — the market found a floor and buyers are stepping in.
The next day acts as a confirmation filter. When the market goes up again the day after a massive rally, it suggests the buying wasn’t just short-covering or panic buying. There’s follow-through conviction.
When the next day is red, it suggests the big up day was exactly what our previous article warned about — a volatility spike in a chaotic market, not a signal of strength.
The Boring Edge Takeaway
- A big up day alone is a warning sign (see our previous analysis). Forward returns are below average at every horizon.
- A big up day + green follow-through is a genuine positive signal. The 80 historical instances show +2.23% at 1 month (66% WR) vs -1.91% (46% WR) for the red-follow-through group.
- But the signal is already in the price. If you waited for confirmation and bought at Day 1’s close, your edge is much smaller: +0.94% at 1 month with a 58% win rate.
- Current read (April 2026): March 31’s +2.91% surge + April 1’s +0.72% follow-through places this event in the historically favorable cohort. The data tilts cautiously bullish over the next 1-3 months.
This analysis covers 19,182 trading days from January 1950 to April 2026. All forward returns are based on closing prices. This is not financial advice — it’s what 75 years of data says happened in similar situations.
Methodology: We define “big up day” as any session where SPX closes >2.85% higher than the previous close (n=152). “Green follow-through” means the very next trading day also closed positive. Forward returns are calculated from the big up day’s close. This is an extension of our original >2.85% day analysis.
 日本語
日本語 Español
 Português
 العربية
 繁體中文
繁體中文 简体中文
简体中文