Bitcoin Strategy Stacking: Supertrend Long + 50 SMA Short — Combined Backtest (2017-2026)
What happens when you combine a trend-following long strategy with a simple moving average short strategy — using the same capital? We tested exactly this: Supertrend (ATR=10, multiplier=3.0) for long signals, plus shorting Bitcoin whenever it’s below the 50-day moving average, both operating on the same $10,000 pool. When both signals fire simultaneously, they cancel out (net flat). The result: CAGR 42.0% — crushing both Supertrend alone (33.5%) and Buy & Hold (38.9%) — with a max drawdown of just -52.7% versus Buy & Hold’s -83.2%. The strategy is invested 83.7% of the time (43% long, 41% short), making your capital work almost continuously.
Key Takeaways
- Combined strategy CAGR: 42.0% — beats Supertrend alone (33.5%), Buy & Hold (38.9%), and 50 SMA short alone (6.7%)
- Total return: +1,847% ($10k → $195k) vs Supertrend alone +1,055% ($115k) vs B&H +1,436%
- Maximum drawdown: -52.7% vs Supertrend -61.5% vs B&H -83.2%
- 120 trades: 52 long, 68 short — about 14 per year
- Win rate: 28.3% — you lose 7 out of 10 trades, but average win (+28.3%) is 5.8x average loss (-4.9%)
- Capital utilization: 83.7% — 43% long, 41% short, only 16% flat
- The 50 SMA short alone is mediocre (CAGR 6.7%), but it fills the gaps when Supertrend is idle — that’s the magic of strategy stacking
The Concept: Strategy Stacking
Most backtests test one strategy in isolation. But real traders don’t leave capital idle — when one strategy is flat, they want it working elsewhere. Strategy stacking runs multiple strategies on the same capital simultaneously:
- Strategy A (Supertrend Long): Go long when Supertrend flips bullish, exit when it flips bearish. Position = +1 or 0.
- Strategy B (50 SMA Short): Go short when price is below the 50-day SMA, cover when above. Position = -1 or 0.
- Net position = A + B: Can be +1 (net long), -1 (net short), or 0 (flat — either both inactive, or both active and canceling out)
Both strategies use 100% of the current equity. If both signals are active simultaneously (Supertrend says long, SMA says short), they cancel out — net flat. This natural hedging is a feature, not a bug: it prevents you from holding a position when two indicators disagree.
Why This Combination?
Supertrend is a solid long-only trend follower (CAGR 33.0% standalone), but it sits in cash about 50% of the time. During those idle periods, Bitcoin is often in a downtrend — exactly when shorting is profitable.
The 50 SMA short is deliberately simple. On its own, it’s a losing strategy for going long (you’d miss most of the bull run), but as a short overlay it captures value during bear markets and corrections. The key insight: a mediocre standalone strategy can still add value when it fills a complementary role.
Strategy Rules
Supertrend (Long Component):
- ATR Period: 10 days
- Multiplier: 3.0
- Buy: Supertrend direction flips from bearish to bullish
- Sell: Supertrend direction flips from bullish to bearish
50 SMA Short (Short Component):
- SMA Period: 50 days
- Short: Close price drops below 50 SMA
- Cover: Close price rises above 50 SMA
Combined Net Position:
- Supertrend Long (+1) and SMA Flat (0) → Net Long (+1)
- Supertrend Flat (0) and SMA Short (-1) → Net Short (-1)
- Both active: Long (+1) + Short (-1) → Net Flat (0) — hedged, no exposure
- Both inactive: Flat (0) + Flat (0) → Net Flat (0) — no position
- Fee: 0.05% per side (0.1% round trip)
Signal Chart: Long, Short & Net Position
The top panel shows BTC price with the 50 SMA (red) and Supertrend line (green = bullish, red = bearish). The middle panel shows each strategy’s individual position. The bottom panel shows the combined net position: green = net long, red = net short, gray = flat.
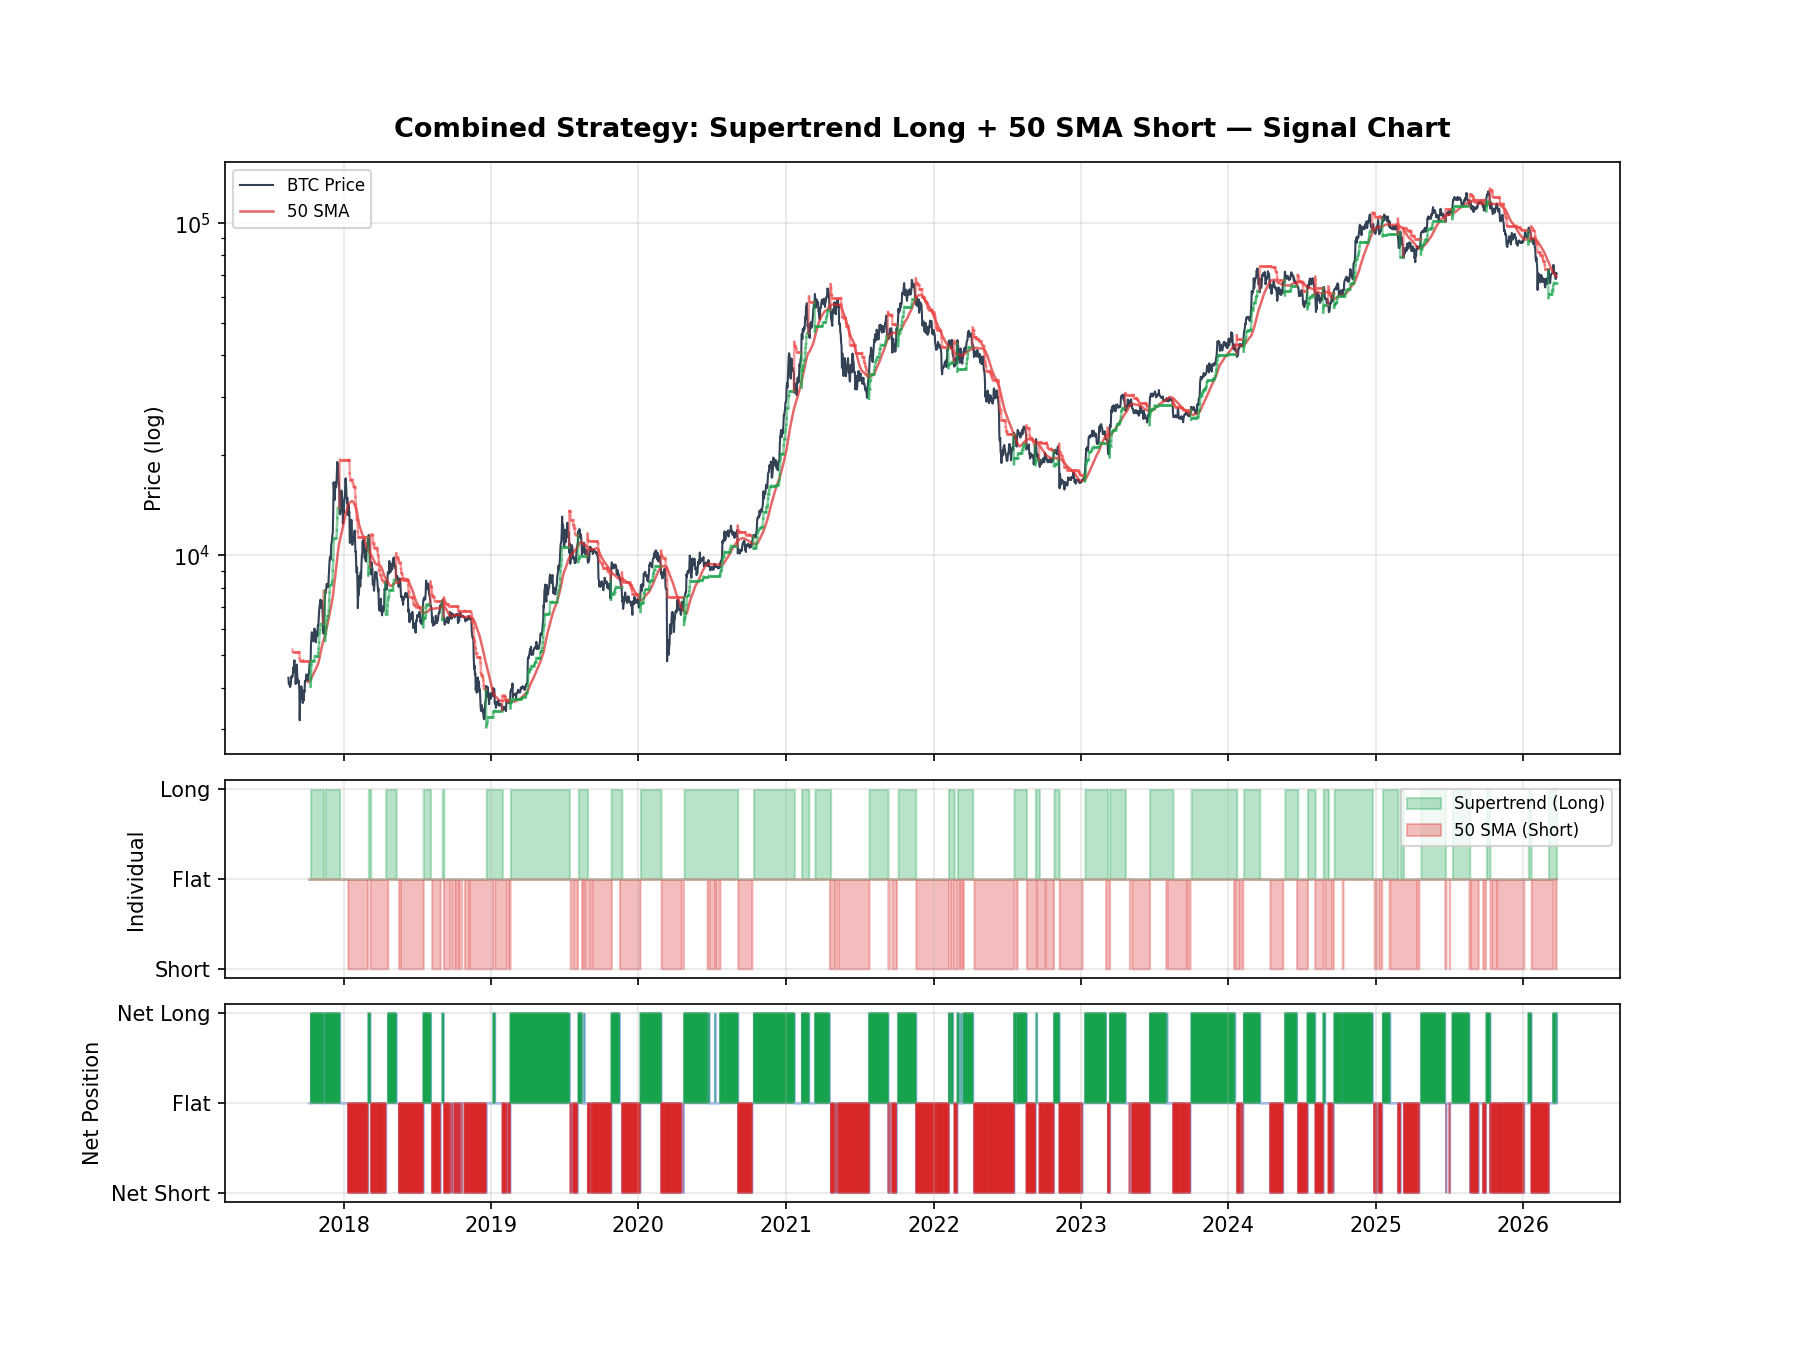
Notice how the two strategies take turns: during bull runs (2020-2021, late 2023-2024), Supertrend handles the long side while SMA is flat. During crashes (2018, 2022), SMA handles the short side while Supertrend is flat. They rarely overlap — and when they do, the natural hedge prevents losses.
Backtest Results
Period: October 2017 – March 2026 (8.5 years). Starting capital: $10,000. Fees: 0.05% per side.
Equity Curve: Combined vs Individual Strategies vs Buy & Hold
This chart shows all four equity lines on the same scale. The blue line (combined) consistently outperforms all others — and it does so with less drawdown.
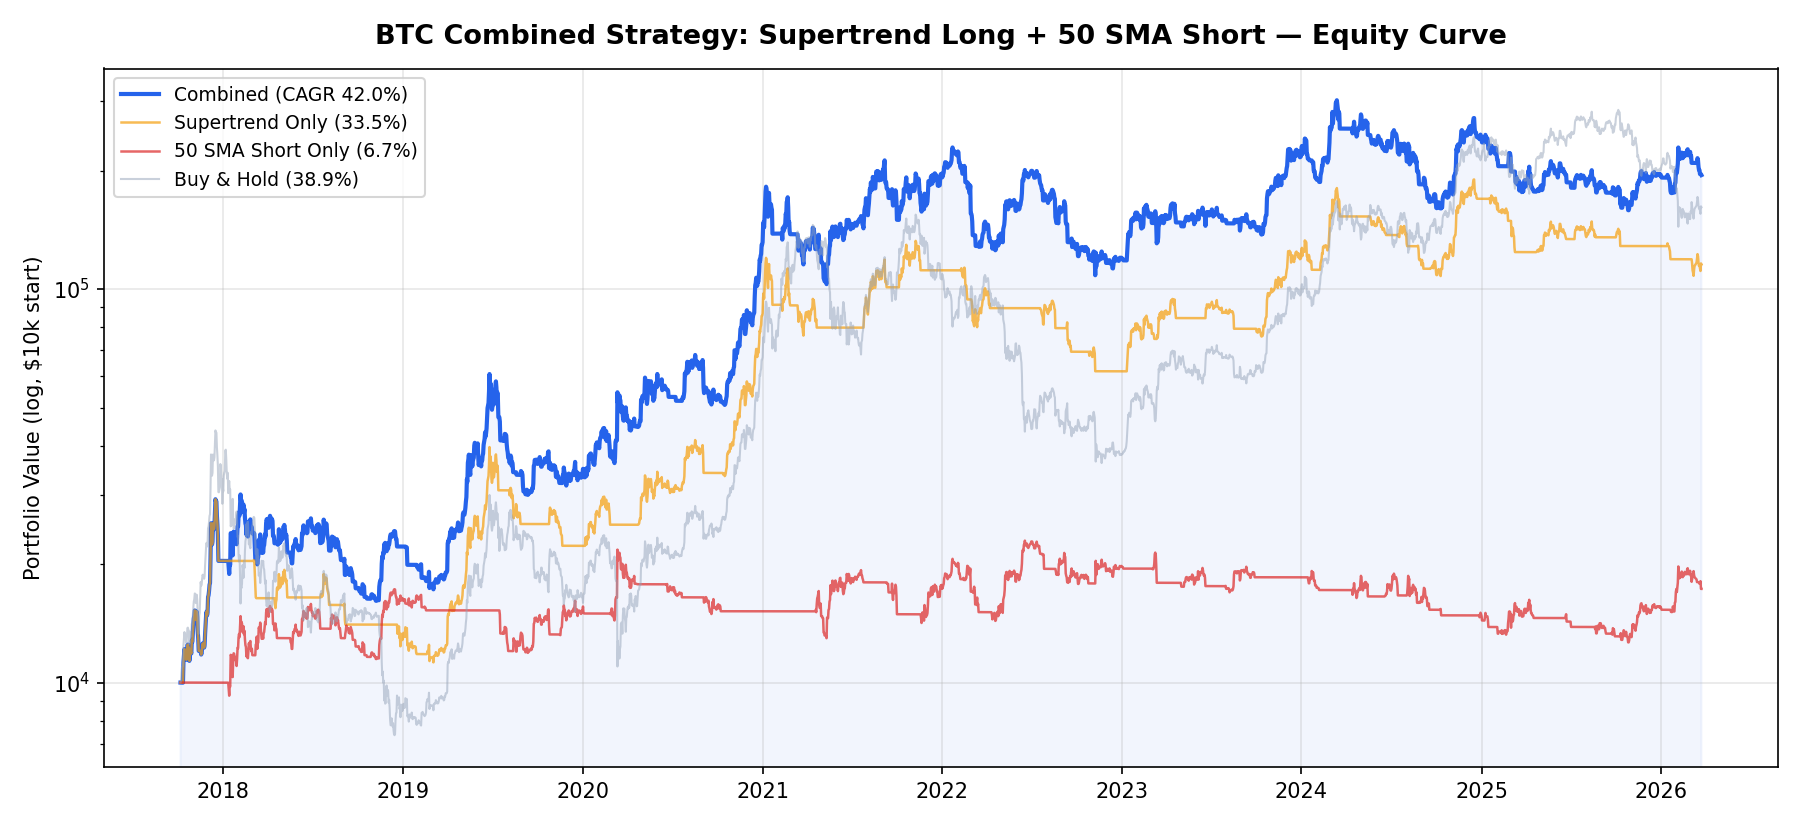
Key observations:
- 2018 bear market: While Buy & Hold crashed -83%, the combined strategy was actively shorting, turning the crash into profit. This is the clearest evidence of the stacking advantage
- 2020-2021 bull run: Supertrend’s long captured +167.6% in the Oct 2020 → Jan 2021 trade. During the May 2021 crash, the SMA short kicked in for +36.6%
- 2022 crypto winter: The April → July 2022 short earned +40.8% while Buy & Hold was in freefall. The combined strategy barely felt the bear market
- 2025-2026: Short positions during recent BTC weakness (+21.1%, +17.8%) kept the strategy growing while Buy & Hold declined
The Stacking Effect: 1 + 1 > 2
The combined strategy significantly outperforms what you’d expect from simply adding the two components:
- Supertrend alone: CAGR 33.5%, final $115k
- 50 SMA Short alone: CAGR 6.7%, final $17k
- Combined: CAGR 42.0%, final $195k ← much more than a simple sum
Why? Compounding. When the short strategy makes money during bear markets, that profit gets reinvested into the next long trade. The long gains compound on a higher base. The same money works twice as hard because it’s rarely idle — 83.7% utilization versus Supertrend’s 49.5%.
Trade Breakdown: Longs vs Shorts
The long and short components have very different profiles:
Long trades (52 total):
- Win rate: 35% — wins less than half, but wins are huge
- Average win: +38.6%, average loss: -5.7%
- Best trade: +167.6% (Oct 2020 → Jan 2021)
- Worst trade: -13.6% (Mar 2018, quick reversal)
Short trades (68 total):
- Win rate: 24% — most short trades are small losses near the SMA
- Average win: +16.6%, average loss: -4.3%
- Best trade: +40.8% (Apr → Jul 2022, the Luna/3AC crash)
- Worst trade: -16.6% (Feb 2022, sharp bounce above SMA)
The shorts have a low win rate (24%) because price frequently oscillates around the 50 SMA, generating small losing trades. But the winning shorts are large enough to cover all the small losses — and their profits compound into the next long entry.
Complete Trade Log
All 120 trades. L = Long (Supertrend), S = Short (50 SMA). ✓ = win, ✗ = loss.
FAQ
Is this realistic to execute? Can you really short Bitcoin easily?
Yes. Most major exchanges (Binance, Bybit, OKX) offer spot margin or perpetual futures that let you short BTC easily. With a futures account, shorting is as simple as going long — just click “sell/short” instead of “buy/long”. The 0.05% fee per side in our backtest already accounts for this.
What about funding rates when shorting via perpetual futures?
Funding rates are a cost we didn’t include. In practice, funding is usually positive (longs pay shorts), meaning you’d actually earn funding while short. During bear markets when our strategy is short, funding is often negative (shorts pay longs), costing perhaps 0.01-0.05% per 8 hours. This would reduce short profits somewhat, but the major winning shorts (+40%, +37%, +22%) would still be solidly profitable.
Why not use a better short strategy instead of simple 50 SMA?
Simplicity is the point. The 50 SMA short component doesn’t need to be great on its own — it just needs to be profitable during periods when Supertrend is idle. More complex short strategies risk overfitting and could conflict with the long component in unpredictable ways. The simple SMA cross provides a reliable “the trend is down” signal with minimal parameters to optimize.
Can I apply this stacking concept to other strategy pairs?
Absolutely. The key principles: (1) choose strategies that are active at different times (complementary, not overlapping), (2) one handles bull markets, one handles bear markets, (3) when both disagree, go flat (natural hedge). You could try Donchian Breakout for longs with any short-selling overlay, for example.
Methodology
This backtest uses real BTC/USDT daily candle data from Binance (October 2017 – March 2026). We apply a 0.05% fee per trade side (0.1% round trip). Both strategies share the same capital pool with 100% allocation. Net position is the sum of individual positions (+1 long, -1 short, or 0 flat). We do not account for funding rates on short positions. Past performance does not guarantee future results.
Disclaimer: This is educational content based on historical data. It is not financial advice. Shorting cryptocurrency carries additional risks including liquidation risk and funding costs. Always do your own research before trading.
 日本語
日本語 Español
 Português
 العربية
 繁體中文
繁體中文 简体中文
简体中文