Bitcoin Just Had 6 Consecutive Red Weeks — This Has Only Happened 3 Times in History
Bitcoin just completed 6 consecutive red weeks from January 25 to March 1, 2026 — dropping 29.8% in the process. Looking at the entire BTC/USDT history since 2017, a streak of 5+ consecutive red weeks has only occurred 3 times. Every single time, BTC bounced within the first week. But the medium-term picture is far more complicated. Here’s the complete statistical breakdown.
The Three Instances
We scanned 449 weekly candles of BTC/USDT history (August 2017 – March 2026) for streaks of 5 or more consecutive red (negative) weeks. Only three instances exist:
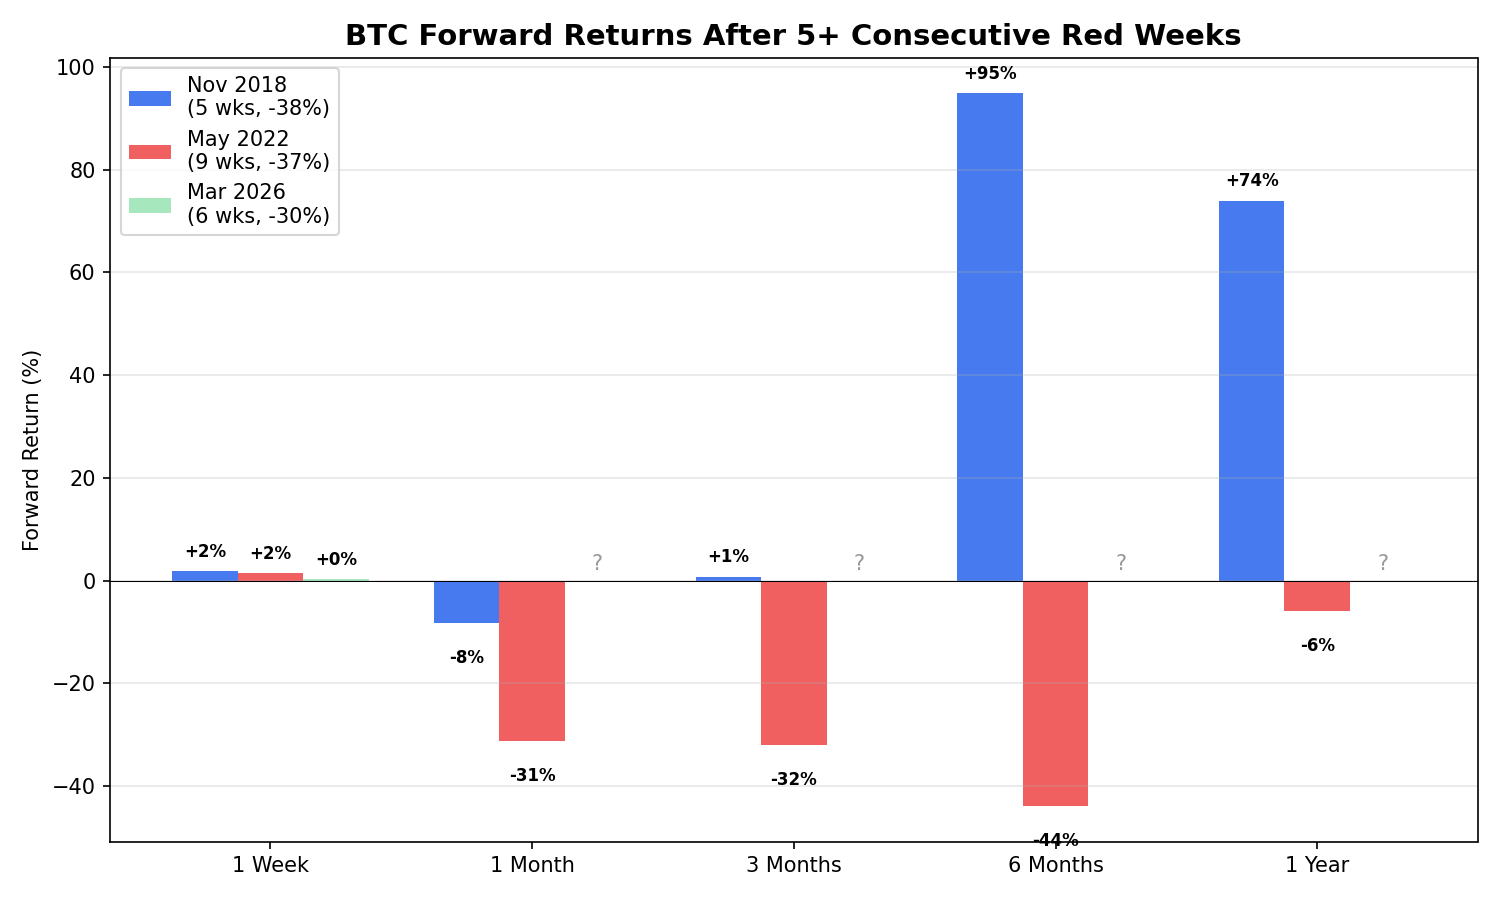
Instance 1: November 2018 (5 red weeks, -38.0%)
This was the final capitulation of the 2018 bear market. BTC had been bleeding for months, and the streak from late October to late November took price from $6,588 down to $4,086 — a brutal -38% in just 5 weeks. This was the “crypto is dead” moment.
- 1 week later: +1.8% — modest bounce
- 1 month later: -8.3% — continued lower to the absolute bottom ($3,200)
- 3 months later: +0.8% — basically flat, but the bottom was in
- 6 months later: +94.9% — massive recovery underway
- 1 year later: +74.0% — solidly in a new bull market
Verdict: Short-term pain continued for about a month, but this streak marked the beginning of the end of the bear market. Buying within a month of the streak end was extremely profitable on a 6-12 month timeframe.
Instance 2: May 2022 (9 red weeks, -37.1%)
The longest streak ever — 9 consecutive red weeks from April to May 2022. This covered the Terra/LUNA collapse and the beginning of the contagion that would later take down 3AC, Celsius, and FTX. BTC dropped from $46,828 to $29,468.
- 1 week later: +1.5% — small bounce
- 1 month later: -31.2% — collapse continued (3AC, Celsius)
- 3 months later: -32.0% — still in the abyss
- 6 months later: -43.9% — FTX collapse made it even worse
- 1 year later: -5.9% — barely recovered after a full year
Verdict: This time, the streak was NOT the capitulation — it was just the beginning. More systemic risk (3AC, Celsius, FTX) lurked beneath the surface. The short-term bounce happened, but it was a trap.
Instance 3: March 2026 (6 red weeks, -29.8%) — CURRENT
We are living through the third instance right now. From January 25 to March 1, 2026, BTC dropped from $93,673 to $65,776 — a 29.8% decline over 6 red weeks. As of writing, BTC has bounced slightly to ~$68,600.
- 1 week later: +0.3% — small bounce (consistent with pattern)
- 1 month later: ??? — this is where it gets interesting
Forward Returns Chart
This chart compares the forward returns across all three instances. The question marks for 2026 represent data we don’t have yet — we’re living through it in real time.
The Pattern
With only 3 instances, we can’t draw statistically robust conclusions. But the pattern is clear enough to be useful:
- The immediate bounce is real. All 3 times, BTC was positive 1 week after the streak ended. This is likely mechanical — extreme selling exhaustion creates a natural mean reversion
- The 1-month mark is dangerous. Both completed instances showed negative returns at 1 month — the bounce faded and selling resumed
- 6-12 months is where divergence happens. In 2018, 6 months later was +95%. In 2022, 6 months later was -44%. The key question is whether the red weeks represent final capitulation (2018) or just the first wave of pain (2022)
- Context matters more than the pattern. In 2018, the streak came after 11 months of bear market — it was late-cycle capitulation. In 2022, the streak came early with hidden systemic risks still unexploded. In 2026, we’re 5 months into the decline from October 2025 ATH
What Should You Watch?
Based on the two historical precedents, here’s what to monitor:
- If BTC holds above $60,000 for the next month → more similar to 2018 (capitulation was the bottom, recovery ahead)
- If BTC breaks below $60,000 within a month → more similar to 2022 (more pain coming, structural risks may be hidden)
- Watch for systemic events. The 2022 streak was followed by cascading failures. If there are no major exchange/fund collapses in the next 2-3 months, the 2018 scenario becomes more likely
Methodology
- Data source: Binance BTC/USDT daily candles (August 2017 – March 2026)
- Weekly candles: Sunday close to Sunday close (449 total weeks)
- Red week definition: Sunday close lower than previous Sunday close
- Streak threshold: 5+ consecutive red weeks
- Forward returns: Calculated from the Sunday close of the final red week
- No lookahead bias: Each instance is marked only when the streak was confirmed (first green week)
This analysis is for educational purposes only and does not constitute financial advice. Sample size (n=3) is extremely small — treat these observations as context, not signals. Past performance does not guarantee future results.
 日本語
日本語 Español
 Português
 العربية
 繁體中文
繁體中文 简体中文
简体中文