Bitcoin Is Down 45% from ATH — Here’s What Happened Every Time BTC Hit -40% (Spoiler: It’s Not What You Think)
Bitcoin is currently 45% below its all-time high of $124,659 (set October 2025). The crypto crowd screams “buy the dip.” But what does the data actually say? We found 11 instances where BTC hit a -40% drawdown from ATH since 2017. The results are sobering: 1 year later, only 1 out of 10 times was BTC higher. A -40% drawdown is not a buy signal — it’s usually a warning that more pain is coming.
Key Statistics
The Drawdown Timeline
This chart shows BTC’s drawdown from its running all-time high over the past 9 years. The yellow dashed line marks the -40% threshold. Every time price touches that line, we record the forward returns.
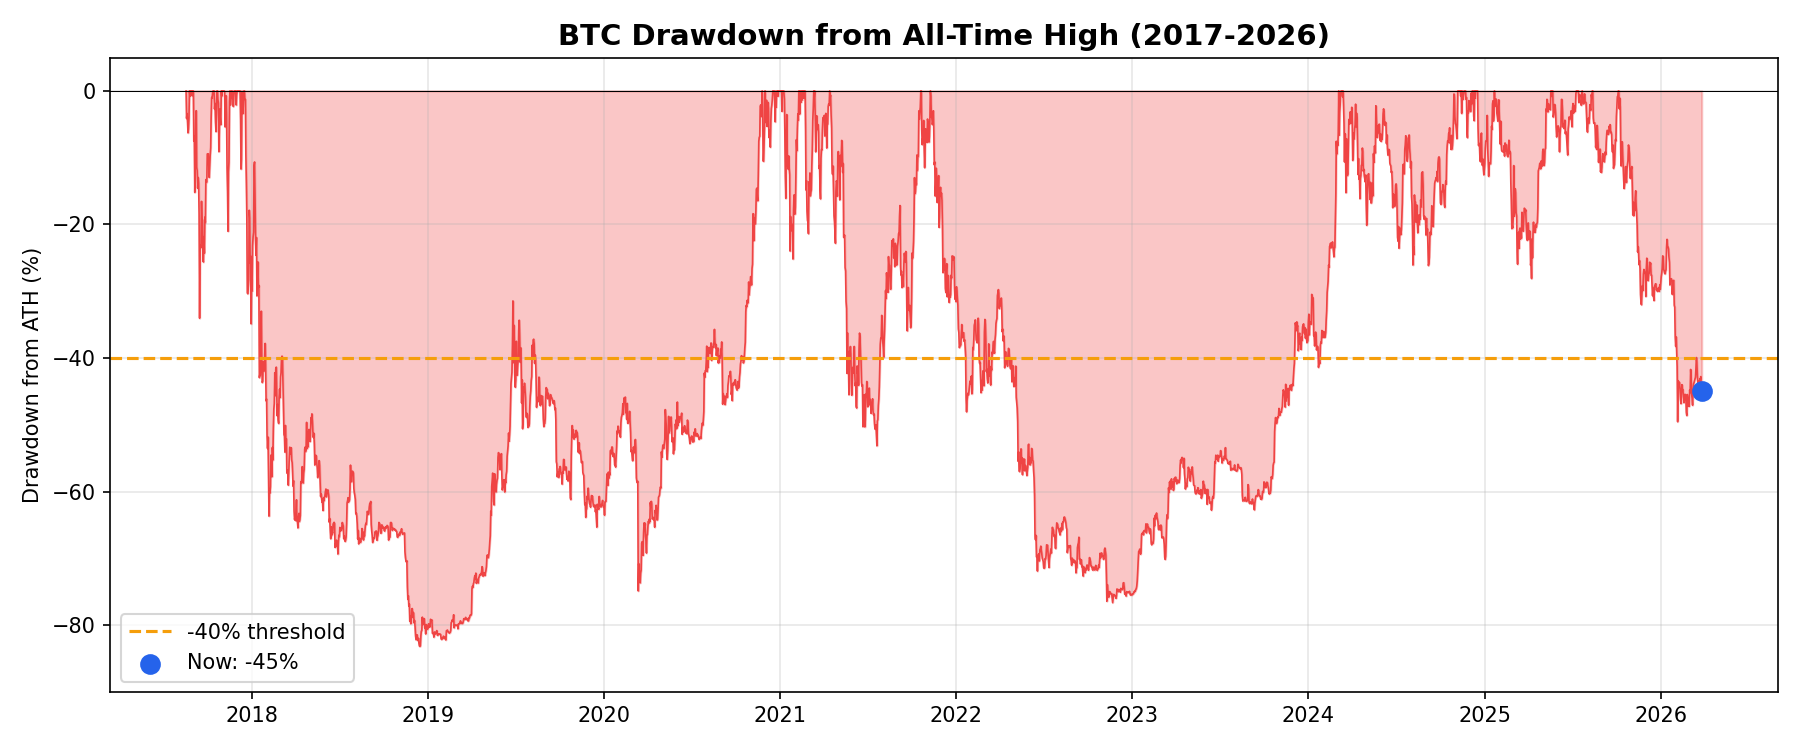
Note how BTC spends significant time in deep drawdowns. The -40% level isn’t rare — it’s been hit in 4 separate cycles (2018, 2019, 2021-2022, 2026).
Forward Returns After Hitting -40%
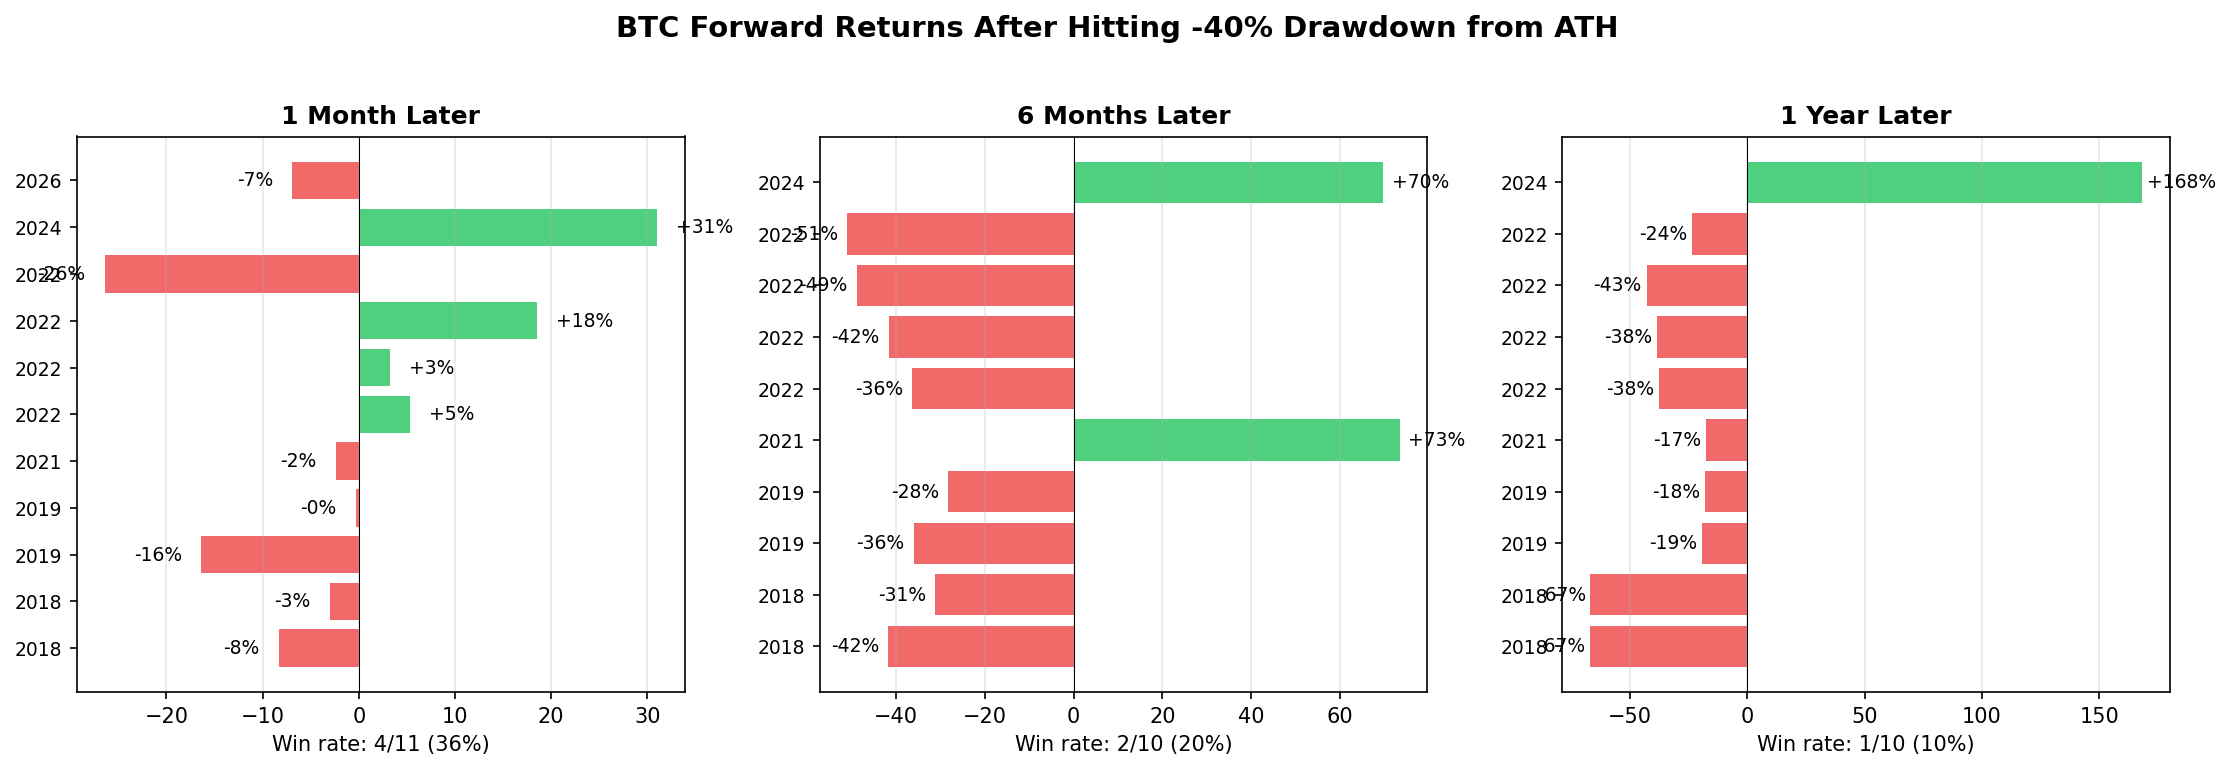
The chart tells the story: the bars are overwhelmingly red. Out of 10 completed instances, only 1 showed positive returns after 1 year — January 2024, which happened to be the exact inflection point of the last bull run (+168%). Every other time, buying at -40% meant holding a losing position for at least a year.
Complete Data: All 11 Instances
The Summary Table
- 1 week forward: avg +0.7%, win rate 45% — basically a coin flip
- 1 month forward: avg -0.5%, win rate 36% — slightly bearish
- 3 months forward: avg -9.1%, win rate 30% — clearly bearish
- 6 months forward: avg -17.2%, win rate 20% — very bearish
- 1 year forward: avg -16.3%, win rate 10% — overwhelmingly bearish
Why “Buy the Dip at -40%” Doesn’t Work
The popular narrative is simple: “BTC is down 40%, it’s cheap, buy now.” The data says the opposite. Here’s why:
- -40% is rarely the bottom. In most cases, BTC continued falling after hitting -40%. The 2018 cycle bottomed at -84%. The 2022 cycle bottomed at -77%. Hitting -40% often means you’re only halfway through the pain
- Bear markets take longer than you think. The average BTC bear market lasts 12-18 months. If you buy at -40%, you could be holding a losing position for over a year while the market continues to grind lower
- The one exception proves the rule. January 2024 was the only time buying at -40% worked spectacularly (+168% in 1 year). But that was after BTC had already spent 2 full years in a bear market. The -40% level was revisited from below, not from above — a fundamentally different situation
- Survivorship bias in crypto culture. People remember the one time they bought the dip and it worked. They don’t talk about the 9 times it didn’t. This creates a false narrative that dip-buying always pays off
What Actually Works Better?
Instead of buying at an arbitrary drawdown level, our backtest data suggests trend-following strategies significantly outperform dip-buying. A simple 50-day SMA strategy (CAGR 44.6%) or Donchian Breakout (CAGR 48.2%) would have kept you out of the market during most of these drawdowns, preserving capital for better entries.
The boring truth: waiting for a confirmed uptrend beats trying to catch a falling knife. Every time.
Current Situation: February 2026
BTC hit the -40% drawdown threshold on February 4, 2026 at $73,166. One month later, it’s down another 7% to around $68,000. This is consistent with the historical pattern — 1-month returns after -40% are slightly negative on average.
The key question is whether this drawdown follows the 2018/2022 pattern (more pain ahead) or the 2024 exception (recovery). We don’t know yet. But the base rate says: don’t bet on the exception.
Methodology
- Data source: Binance BTC/USDT daily candles (August 2017 – March 2026)
- ATH tracking: Running all-time high, updated daily
- Trigger: First day close price is ≥40% below the running ATH
- Cooldown: After triggering, the signal resets only when drawdown recovers above -35% (prevents double-counting in the same drawdown cycle)
- Forward returns: Calculated from the trigger day’s close price
This analysis is for educational purposes only and does not constitute financial advice. Past performance does not guarantee future results. Always do your own research.
 日本語
日本語 Español
 Português
 العربية
 繁體中文
繁體中文 简体中文
简体中文