Bitcoin Dropped 14% in a Single Day โ€” This Has Happened Only 16 Times Since 2017

๐Ÿ“‹ Disclosure: This article may contain affiliate links. We earn a commission at no extra cost to you. Learn more

On February 5, 2026, Bitcoin dropped 14.0% in a single day โ€” from $73,166 to $62,910.
This is only the 16th time BTC has fallen 12% or more in one day since Binance started trading in 2017.
We don’t predict. We count. Here’s what the data says.

All 16 Instances of -12% Single-Day Drops
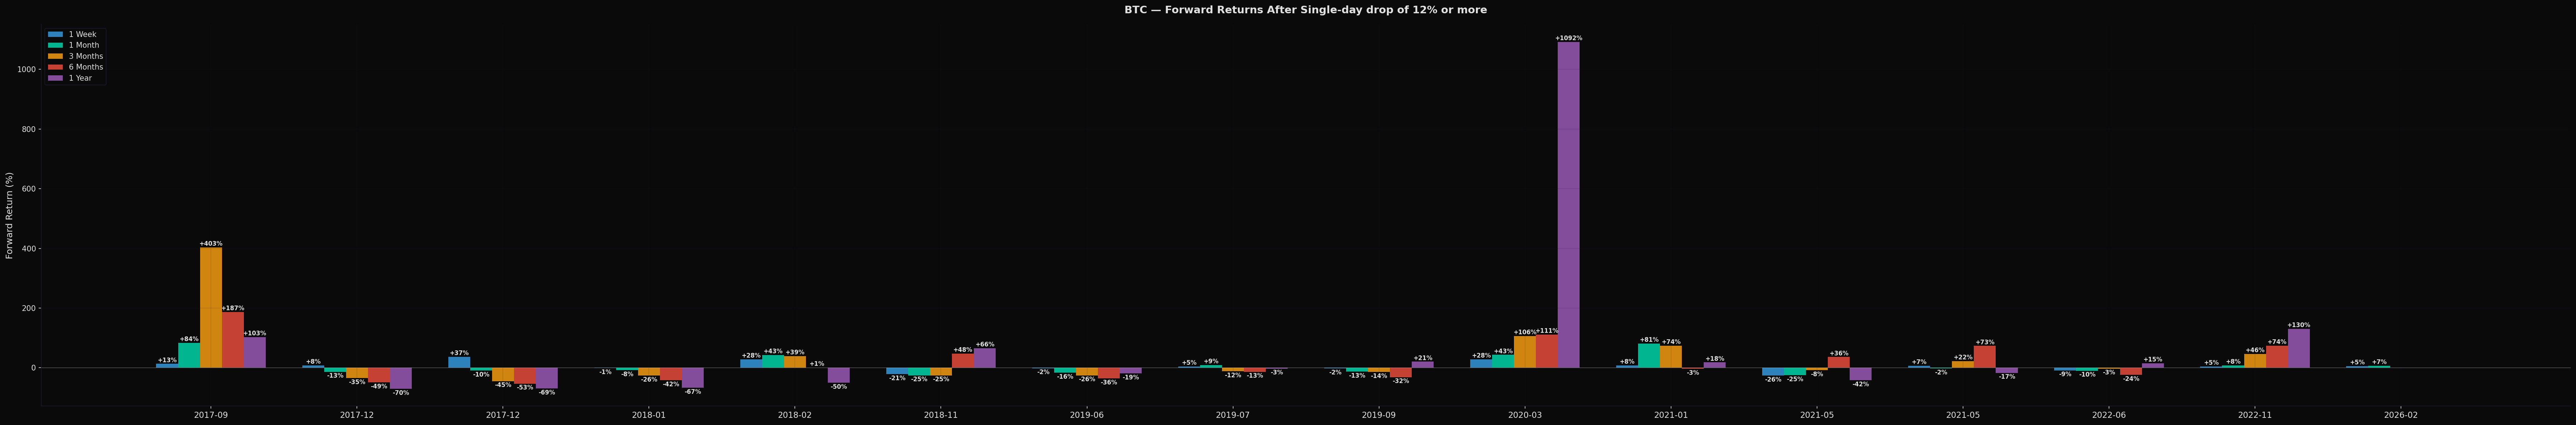
#1 โ€” 2017-09-14
-19.2%
$3,945 โ†’ $3,189 (China ICO ban)
1W: +13.2% 1M: +84.1% 3M: +402.8% 1Y: +103.1%

#2 โ€” 2017-12-22
-14.0%
$15,493 โ†’ $13,327 (2017 top crash)
1W: +7.9% 1M: -13.5% 3M: -34.5% 1Y: -70.4%

#3 โ€” 2017-12-30
-13.5%
$14,379 โ†’ $12,440
1W: +37.2% 1M: -9.6% 3M: -45.0% 1Y: -69.4%

#4 โ€” 2018-01-16
-19.5%
$13,540 โ†’ $10,900 (China ban FUD)
1W: -0.9% 1M: -8.3% 3M: -26.0% 1Y: -67.1%

#5 โ€” 2018-02-05
-15.2%
$8,185 โ†’ $6,940 (Global equity selloff)
1W: +28.3% 1M: +42.8% 3M: +39.2% 1Y: -50.0%

#6 โ€” 2018-11-19
-13.3%
$5,662 โ†’ $4,910 (BCH hash war)
1W: -21.3% 1M: -25.4% 3M: -25.3% 1Y: +65.7%

#7 โ€” 2019-06-27
-13.5%
$13,094 โ†’ $11,330
1W: -1.6% 1M: -16.4% 3M: -25.6% 1Y: -19.1%

#8 โ€” 2019-07-16
-12.9%
$10,839 โ†’ $9,440
1W: +4.5% 1M: +9.1% 3M: -11.6% 1Y: -2.6%

#9 โ€” 2019-09-24
-12.5%
$9,702 โ†’ $8,493 (Bakkt launch selloff)
1W: -2.4% 1M: -12.7% 3M: -13.8% 1Y: +20.6%

#10 โ€” 2020-03-12 ๐Ÿ†
-39.5%
$7,935 โ†’ $4,800 (COVID Black Thursday)
1W: +28.4% 1M: +43.3% 3M: +105.9% 1Y: +1,092%

#11 โ€” 2021-01-21
-13.0%
$35,468 โ†’ $30,850
1W: +8.2% 1M: +81.0% 3M: +74.3% 1Y: +18.1%

#12 โ€” 2021-05-12
-12.4%
$56,670 โ†’ $49,631 (Elon dumps BTC)
1W: -26.1% 1M: -24.8% 3M: -8.2% 1Y: -41.5%

#13 โ€” 2021-05-19
-14.4%
$42,850 โ†’ $36,690 (China mining ban)
1W: +7.0% 1M: -2.4% 3M: +21.8% 1Y: -17.4%

#14 โ€” 2022-06-13
-15.4%
$26,575 โ†’ $22,487 (Celsius/3AC collapse)
1W: -8.5% 1M: -10.0% 3M: -2.9% 1Y: +15.3%

#15 โ€” 2022-11-09
-14.1%
$18,547 โ†’ $15,923 (FTX collapse)
1W: +4.7% 1M: +7.6% 3M: +46.0% 1Y: +130.5%

#16 โ€” 2026-02-05 โฌ… NOW
-14.0%
$73,166 โ†’ $62,910
1W: +5.3% 1M: +6.9% 3M: TBD 1Y: TBD

BTC Single Day Drop 12%+ Forward Returns Chart

The Short-Term Bounce Is Real โ€” But Don’t Trust It

The first thing that jumps out: 62.5% of the time, BTC bounces within 1 week of a 12%+ daily crash. The average 1-week return is +5.2%.

Panic selling creates short-term oversold conditions, and some recovery is natural. But here’s where it gets tricky:

1 Week Later
+5.2% avg
Win Rate: 62.5% (10/16)

1 Month Later
+9.5% avg
Win Rate: 43.8% | Median: -5.3%

3 Months Later
+33.1% avg
Win Rate: 40.0% | Median: -8.2%

1 Year Later
+73.9% avg
Win Rate: 46.7% | Median: -2.6%

Why Averages Lie: The Outlier Problem

The 1-year average is +73.9%. Sounds great, right?

Now look at the median: -2.6%. And the win rate: 46.7%.

The average is completely distorted by one event: COVID Black Thursday (March 12, 2020), which returned +1,092% over the following year. Remove that single outlier and the 1-year average drops to +1.4%.

A few massive winners hide a majority of losers. More than half the time, you’re still underwater 1 year after a 12%+ crash.

The Two Regimes

These 12%+ crashes fall into two distinct categories:

Category A: Mid-cycle shakeout
2017-09-14, 2018-02-05, 2020-03-12, 2021-01-21, 2022-11-09 โ€” occurred during or before bull runs. Average 1Y return: +258%.

Category B: Bear market acceleration
2017-12 (x2), 2018-01, 2018-11, 2019-06/07/09, 2021-05, 2022-06 โ€” occurred during confirmed downtrends. Average 1Y return: -31%.

The crash itself tells you nothing. What matters is the regime you’re in.

February 5, 2026: Which Category?

BTC dropped 14.0% from $73,166 to $62,910. One week later: +5.3%. One month later: +6.9%. The short-term bounce played out exactly as history predicts.

Currently at ~$68,700, still down 37% from ATH. Whether this becomes Category A or B remains to be seen.

Methodology

  • Data source: Binance BTCUSDT spot market, daily OHLCV
  • Period: August 2017 โ€“ March 2026 (3,145 trading days)
  • Threshold: Daily close-to-close return โ‰ค -12%
  • Forward returns calculated from crash-day closing price
  • 16 qualifying instances identified

Disclaimer: This is historical statistical analysis only, not financial advice. Past patterns may not repeat.

Ready to trade smarter?

We use these tools to execute our strategies.

See Our Recommended Tools
Disclaimer: This content is for educational and informational purposes only. It does not constitute financial advice. Past performance does not guarantee future results. Always do your own research. Some links are affiliate links.

Leave a Reply

Your email address will not be published. Required fields are marked *