Bitcoin Just Had 8 Consecutive Green Days — This Has Only Happened 7 Times in History
From March 9 to March 16, 2026, Bitcoin posted 8 consecutive green daily candles, rallying from $65,971 to $74,885 (+13.5%).
In BTC’s entire trading history since 2017, this has happened exactly 7 times.
You’d think 8 straight green days is bullish. The data says otherwise.
All 7 Instances of 8+ Consecutive Green Days
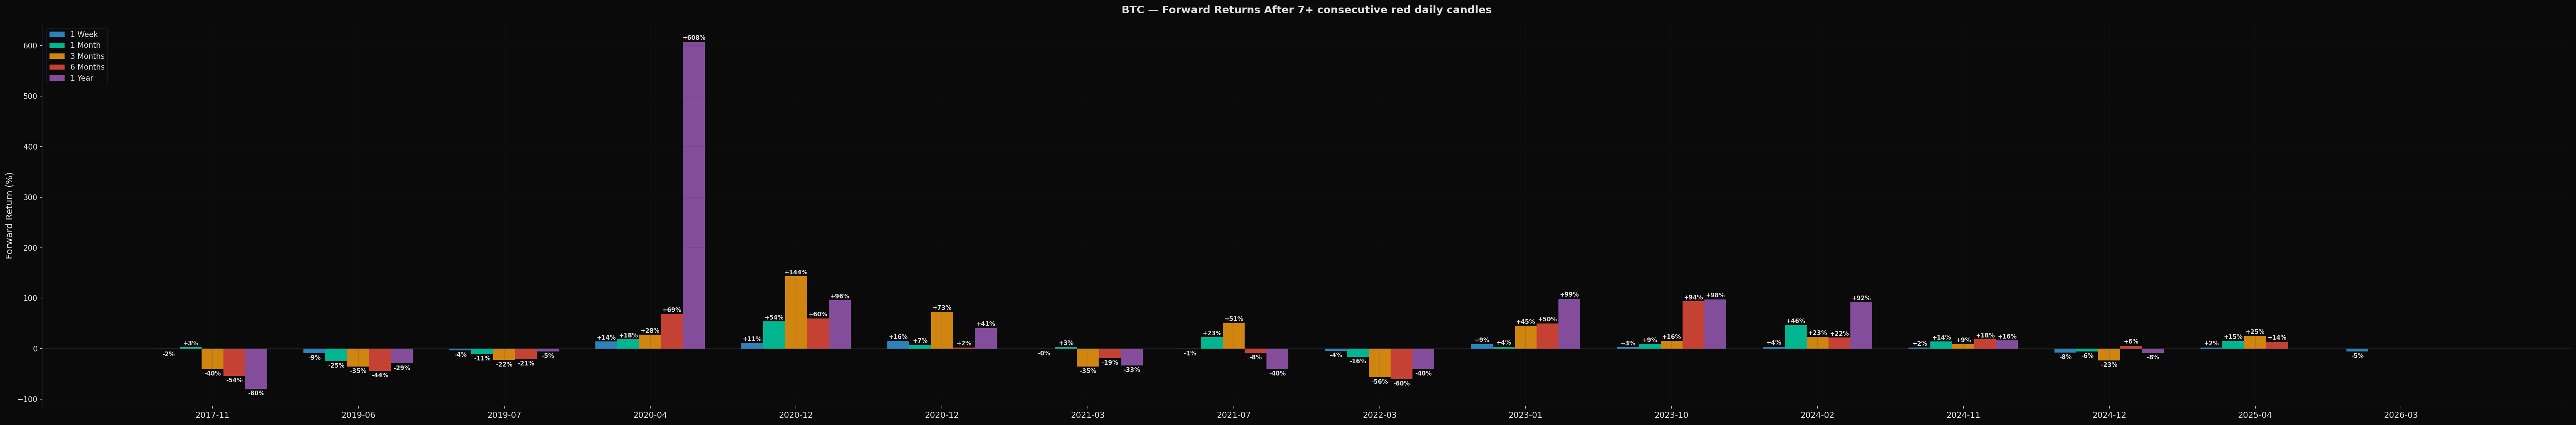
The Counter-Intuitive Truth: 8 Green Days Is a Warning Sign
71% of the time, BTC is lower within 1 week of an 8-day green streak.
At the 6-month and 1-year horizon, only 33% of instances ended positive. The average 6-month return is -14.2%.
Why Does This Happen?
Eight consecutive green days is statistically extreme — roughly a 0.4% probability (1/256) in a random walk. When it happens, it signals one of two things:
Exhaustion rally before reversal (5 out of 7 instances):
- Dec 2017: 8 green days to $17K, then crashed 84% over the next year
- Jun 2019: 8 green days to $13K, then bled 6 months to $7.3K
- Jul 2021: Dead cat bounce $29K → $40K, then bear continued
- Mar 2022: Bear rally $38K → $44K, then crashed to $15K
- Jan 2025: Rally to $93K, now at $68K six months later
Early bull run confirmation (2 out of 7 instances):
- Dec 2020: $17K → $23K, continued to $64K within 4 months
- Feb 2024: $42K → $49K, continued to $73K within 1 month (ETF momentum)
The ratio: 5 out of 7 times, the 8-day green streak marked a local top.
March 2026: Already Following the Bearish Pattern
The current instance (March 9–16) has already started tracking the bearish path. In the week following the streak, BTC dropped 5.3% — consistent with the 71% immediate pullback rate.
BTC is currently down 37% from ATH ($109K). The 8-day bounce from $66K to $75K could be a bear market rally (like Mar 2022) or an accumulation bounce (like Dec 2020).
With a 33% historical win rate at 6-month and 1-year marks, the statistical base case leans bearish.
Methodology
- Data source: Binance BTCUSDT spot market, daily OHLCV
- Period: August 2017 – March 2026 (3,145 trading days)
- A “green day” = daily close > daily open
- Threshold: 8+ consecutive green daily candles
- Forward returns from final green day’s closing price
- 7 qualifying instances identified
Disclaimer: This is historical statistical analysis only, not financial advice. Past patterns may not repeat.
 日本語
日本語 Español
 Português
 العربية
 繁體中文
繁體中文 简体中文
简体中文