SPX Gained 2.9% in a Single Day — History Says Don’t Celebrate Yet
The S&P 500 just posted its biggest daily gain in 90 trading days. Here’s what happened every other time it did that — and why the numbers should make you uncomfortable.
The Setup
On March 31, 2026, the S&P 500 surged 2.91% in a single session — the largest daily gain in 90 trading days.
Financial media called it a relief rally. Pundits talked about “bottoming signals.” Retail traders posted rocket emojis.
But we don’t trade feelings at Boring Edge. We trade data. So we scanned every trading day since 1950 and asked a simple question:
What actually happens after the S&P 500 gains more than 2.85% in a single day?
The answer might ruin your bullish mood.
152 Times in 75 Years
Since 1950, the S&P 500 has gained more than 2.85% in a single session exactly 152 times. That’s roughly once every 126 trading days — or about twice a year.
Not super rare. Not super common. But definitely unusual enough to notice.
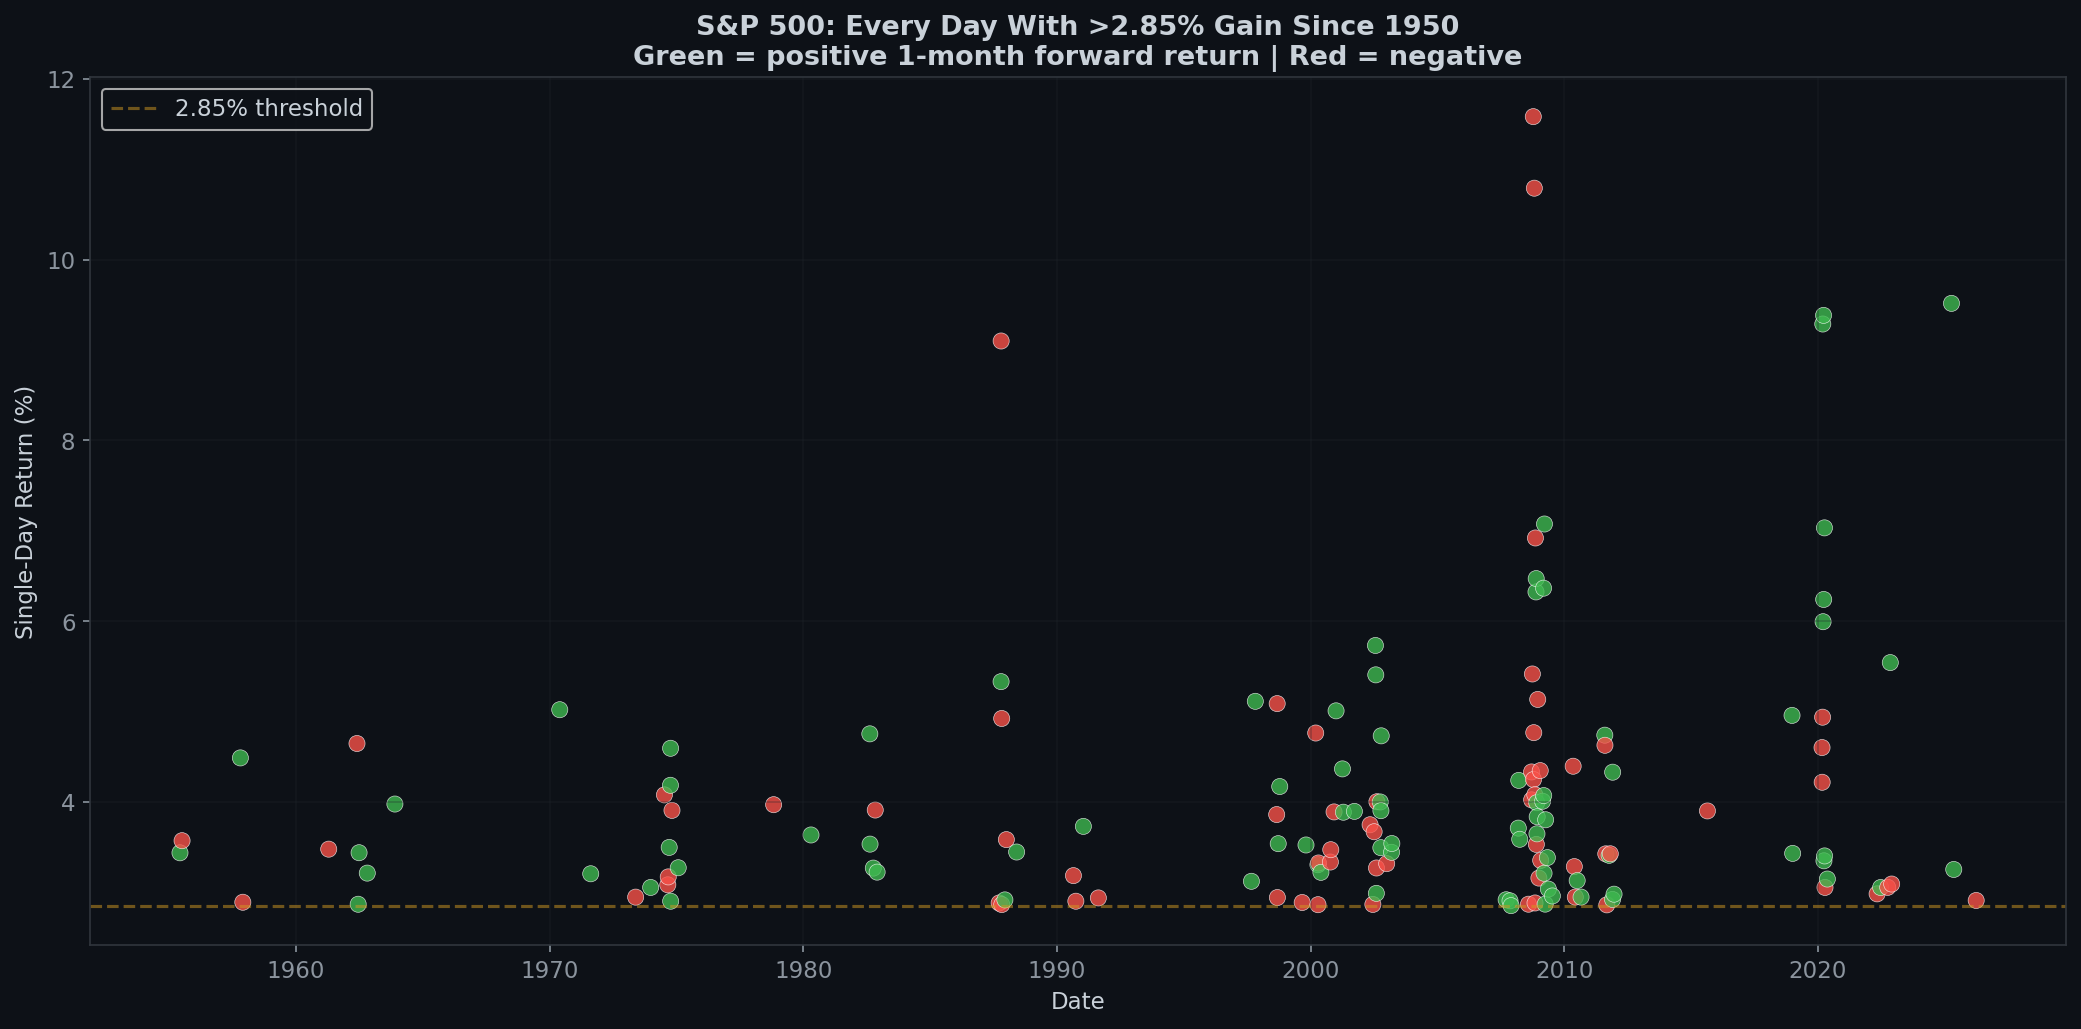
Notice anything? Those dots cluster. They don’t spread evenly across decades. The 2000s alone had 64 events — more than the 1950s through 1990s combined.
The Forward Returns Are… Disappointing
Here’s the part that should bother anyone who bought the rip:
| Period | After >2.85% Day | All Days Average | Difference |
|---|---|---|---|
| 1 Day | -0.14% | +0.05% | -0.19% |
| 5 Days | -0.36% | +0.25% | -0.61% |
| 2 Weeks | +0.02% | +0.51% | -0.49% |
| 1 Month | +0.26% | +1.09% | -0.83% |
| 3 Months | +2.60% | +3.32% | -0.72% |
Read that again carefully.
At every single time horizon — from 1 day to 3 months — buying after a >2.85% day gives you WORSE returns than buying on a random day.
The 1-day average is actually negative (-0.14%). The 5-day average is even worse (-0.36%). You don’t break even until about 2 weeks out, and even then, you’re still underperforming a random entry by nearly half a percent.
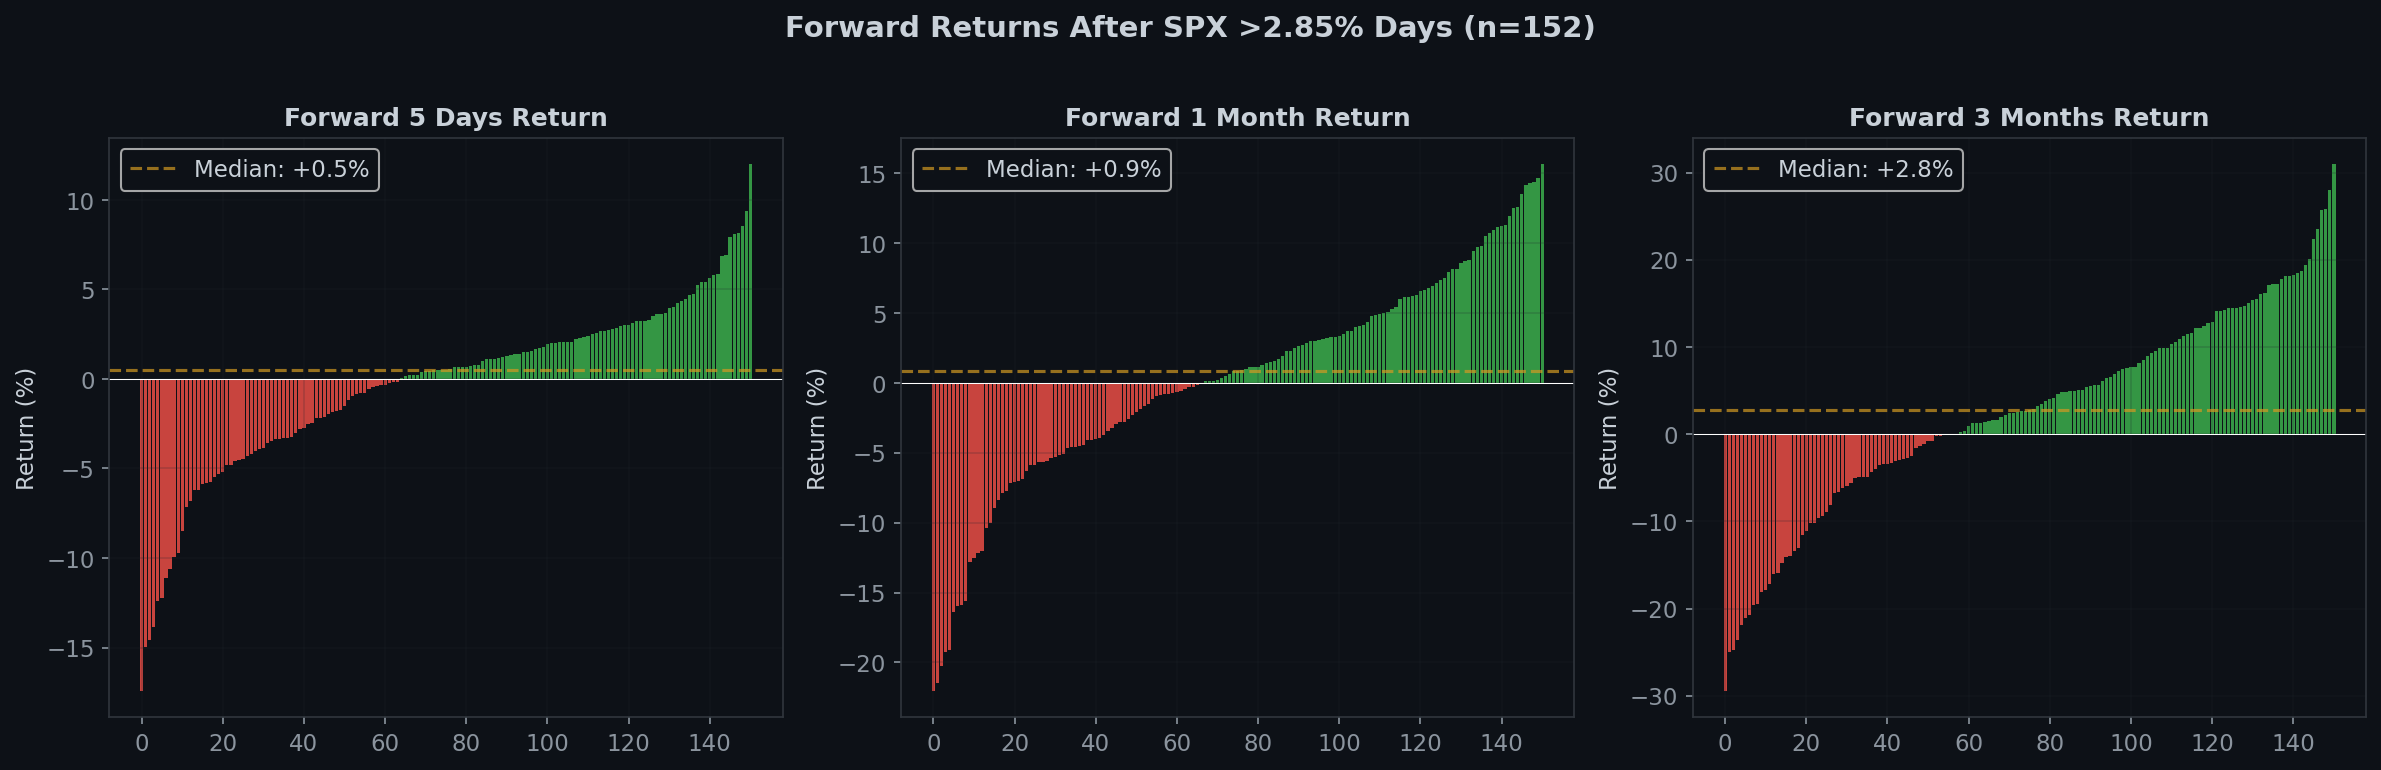
Win Rate: Not Terrible, But Not Reassuring
To be fair, the win rates aren’t atrocious:
- 1 Day: 52.3% (basically a coin flip)
- 5 Days: 57.6%
- 2 Weeks: 55.6%
- 1 Month: 56.3%
- 3 Months: 62.9%
At 3 months, you have a ~63% chance of being in the green. That’s not bad in isolation. But the S&P 500’s baseline 3-month win rate is about 66%. So you’re actually slightly worse off than average.
The Real Story: Volatility Explodes
Here’s where it gets interesting. Forget returns for a moment. Look at what happens to volatility after a >2.85% day:
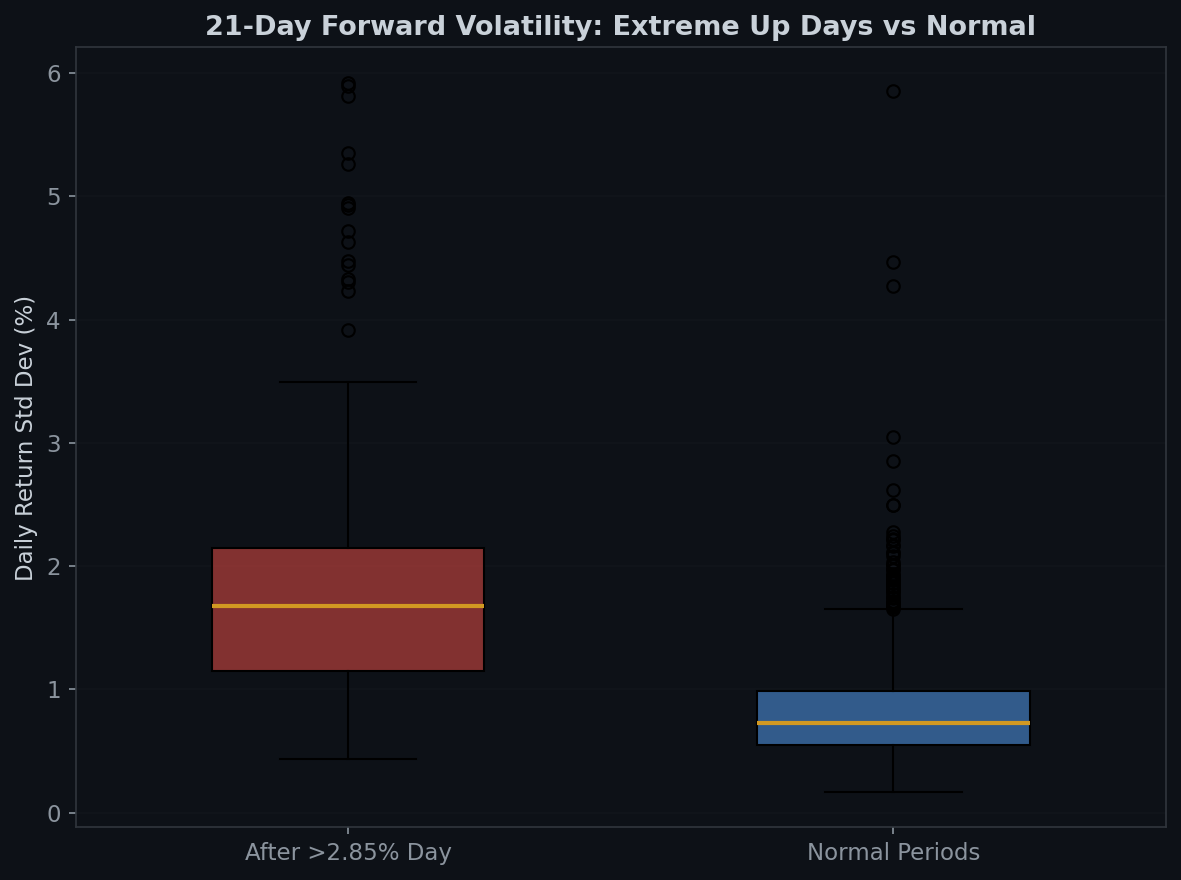
- After an extreme up day: 1.94% daily standard deviation over the next 21 days
- Normal periods: 0.84% daily standard deviation
That’s 2.3x higher volatility.
This is the critical insight: a single-day gain of 2.85%+ is not a signal that the market has calmed down. It’s a signal that the market is in chaos. Huge up days don’t happen in calm markets. They happen when prices are swinging wildly — which means huge down days are equally likely.
Think of it this way: if the market was a heart monitor, a +2.9% day isn’t a sign of health. It’s an arrhythmia.
The Boring Edge Takeaway
The data is clear:
- Big up days are symptoms of volatility, not signals of strength. The market doesn’t gap 3% higher because everything is fine. It does it because fear just switched to greed — temporarily.
- Forward returns are below average at every time horizon. You’re not getting rewarded for the excitement. You’re getting punished.
- Volatility stays elevated for at least a month. The next 21 days will be a rollercoaster. The question is whether you have the stomach for it.
- The boring truth: The best entries are the boring ones. When the market drifts up 0.3% on a Tuesday with average volume — that’s the environment where forward returns are best. Excitement is the enemy of returns.
This analysis covers 19,181 trading days from January 1950 to March 2026. All forward returns are based on closing prices. Past performance doesn’t guarantee future results, but 75 years of data is hard to argue with.
Methodology: We define “extreme up day” as any session where SPX closes >2.85% higher than the previous close. Forward returns are calculated from that day’s close. Volatility is measured as the standard deviation of daily returns over the following 21 trading days, compared against 1,000 randomly sampled 21-day windows.
 日本語
日本語 Español
 Português
 العربية
 繁體中文
繁體中文 简体中文
简体中文