When 90 Days of Calm Get Shattered: The Low-Volatility Breakout Signal
The S&P 500 went 90 trading days without a single move exceeding 2.85%. Then it happened. History has a name for this pattern — and a warning.
The Calm Before the Storm
On March 31, 2026, SPX didn’t just gain 2.91%. It broke a 90-day streak of contained volatility — no single session had exceeded ±2.85% in the prior three months.
We scanned every instance since 1950 where SPX went at least 90 trading days without a ±2.85% move, then broke that streak.
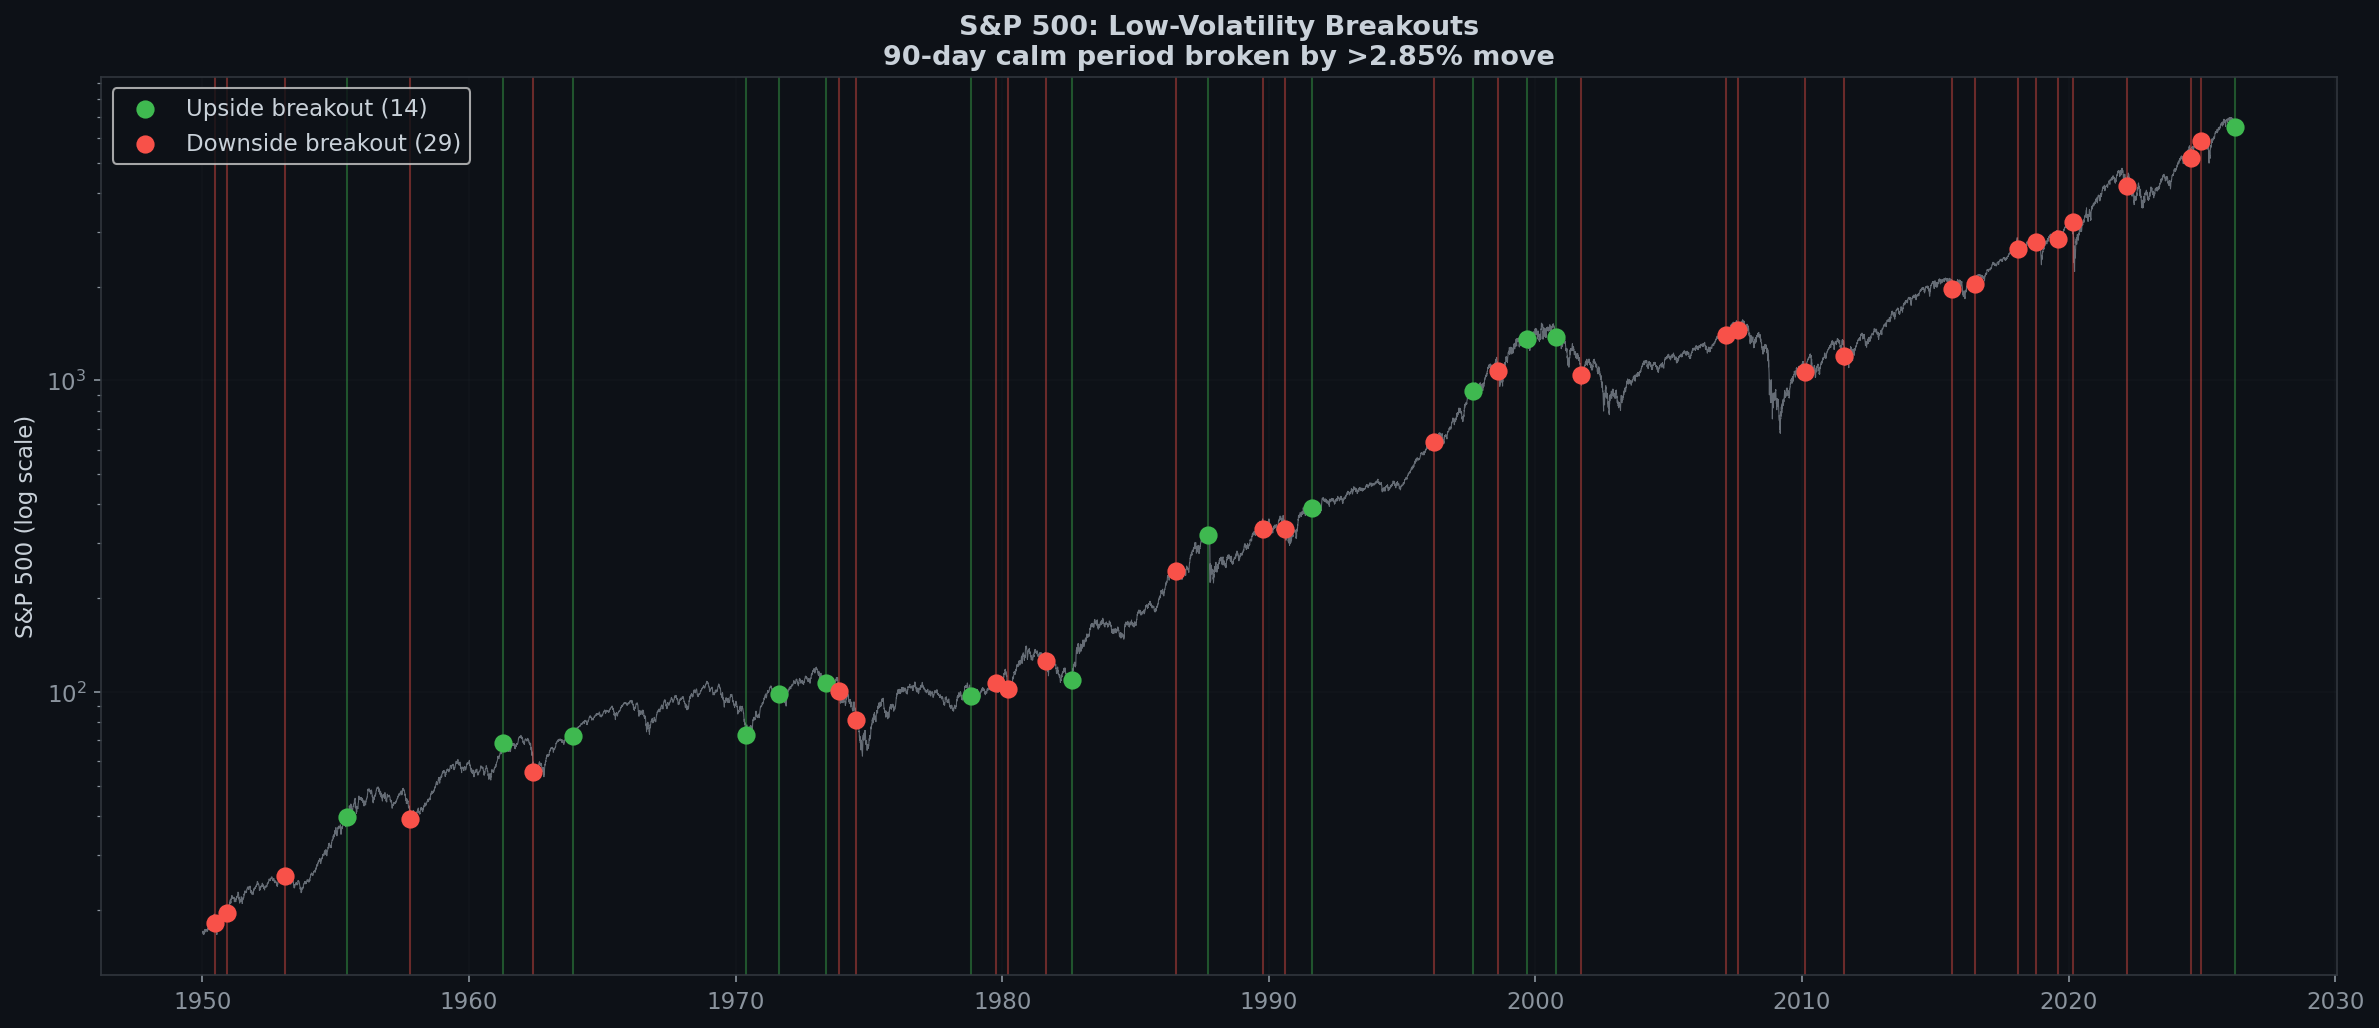
43 Breakouts in 75 Years
- 14 upside breakouts (calm broken by a big up day)
- 29 downside breakouts (calm broken by a big down day)
That 2:1 ratio is already telling. When a long period of calm gets shattered, it’s twice as likely to break to the downside.
Upside Breakout Forward Returns (n=14)
| Period | Average Return | Win Rate |
|---|---|---|
| 1 Day | -0.00% | 62% |
| 5 Days | +0.60% | 62% |
| 2 Weeks | +0.62% | 54% |
| 1 Month | -0.17% | 46% |
| 3 Months | +1.70% | 54% |
The 1-month forward return is negative on average (-0.17%), with a coin-flip 46% win rate. Upside breakouts don’t signal the start of a rally. They signal the end of calm and the beginning of a volatile regime.
The 1987 Case Study
September 22, 1987: SPX breaks 90 days of calm with a +2.89% upside move. Everything looks bullish. The market has been rallying all year.
October 19, 1987 (19 trading days later): Black Monday. SPX drops 20.47% in a single day.
The upside breakout wasn’t a buy signal. It was the market’s nervous system firing — an early tremor before the earthquake.
Selected Breakout Events
Notable upside breakouts:
- Aug 17, 1982 (+4.76%) — Beginning of the greatest bull run ✓
- Sep 22, 1987 (+2.89%) — 19 days before Black Monday ⚠️
- Oct 13, 2000 (+3.34%) — Dot-com crash had already begun ⚠️
- Mar 31, 2026 (+2.91%) — Today 🔍
Notable downside breakouts:
- May 28, 1962 (-6.68%) — Kennedy Slide
- Oct 13, 1989 (-6.12%) — Friday the 13th mini-crash
- Feb 24, 2020 (-3.35%) — COVID first shoe drop
- Aug 5, 2024 (-3.00%) — Yen carry trade unwind
The Boring Edge Takeaway
- When calm breaks, the direction matters less than the fact that it broke. Volatility regimes are sticky. Expect more big moves in both directions.
- Downside breakouts are 2x more common. The base rate is 67% downside.
- The 1987 analog: Not saying March 2026 is October 1987. But the structure is the same: prolonged calm → upside breakout → ???
- What to watch: If the next 2-3 weeks produce multiple ±2% sessions, the volatility regime has shifted. Size down and widen stops.
Data: S&P 500, January 1950 – March 2026. A “low-volatility breakout” is defined as a day where the absolute return exceeds 2.85% after at least 90 consecutive trading days where no such move occurred.
 日本語
日本語 Español
 Português
 العربية
 繁體中文
繁體中文 简体中文
简体中文