90% of the Biggest SPX Rallies Happened in Bear Markets
The most exciting days in stock market history all happened when things were terrible. Here’s the proof — and why “boring” is the real bull signal.
A Counterintuitive List
If someone asked you to guess when the biggest single-day gains in S&P 500 history occurred, you might guess during euphoric bull markets. Maybe the dot-com boom. Maybe the post-COVID recovery.
You’d be wrong.
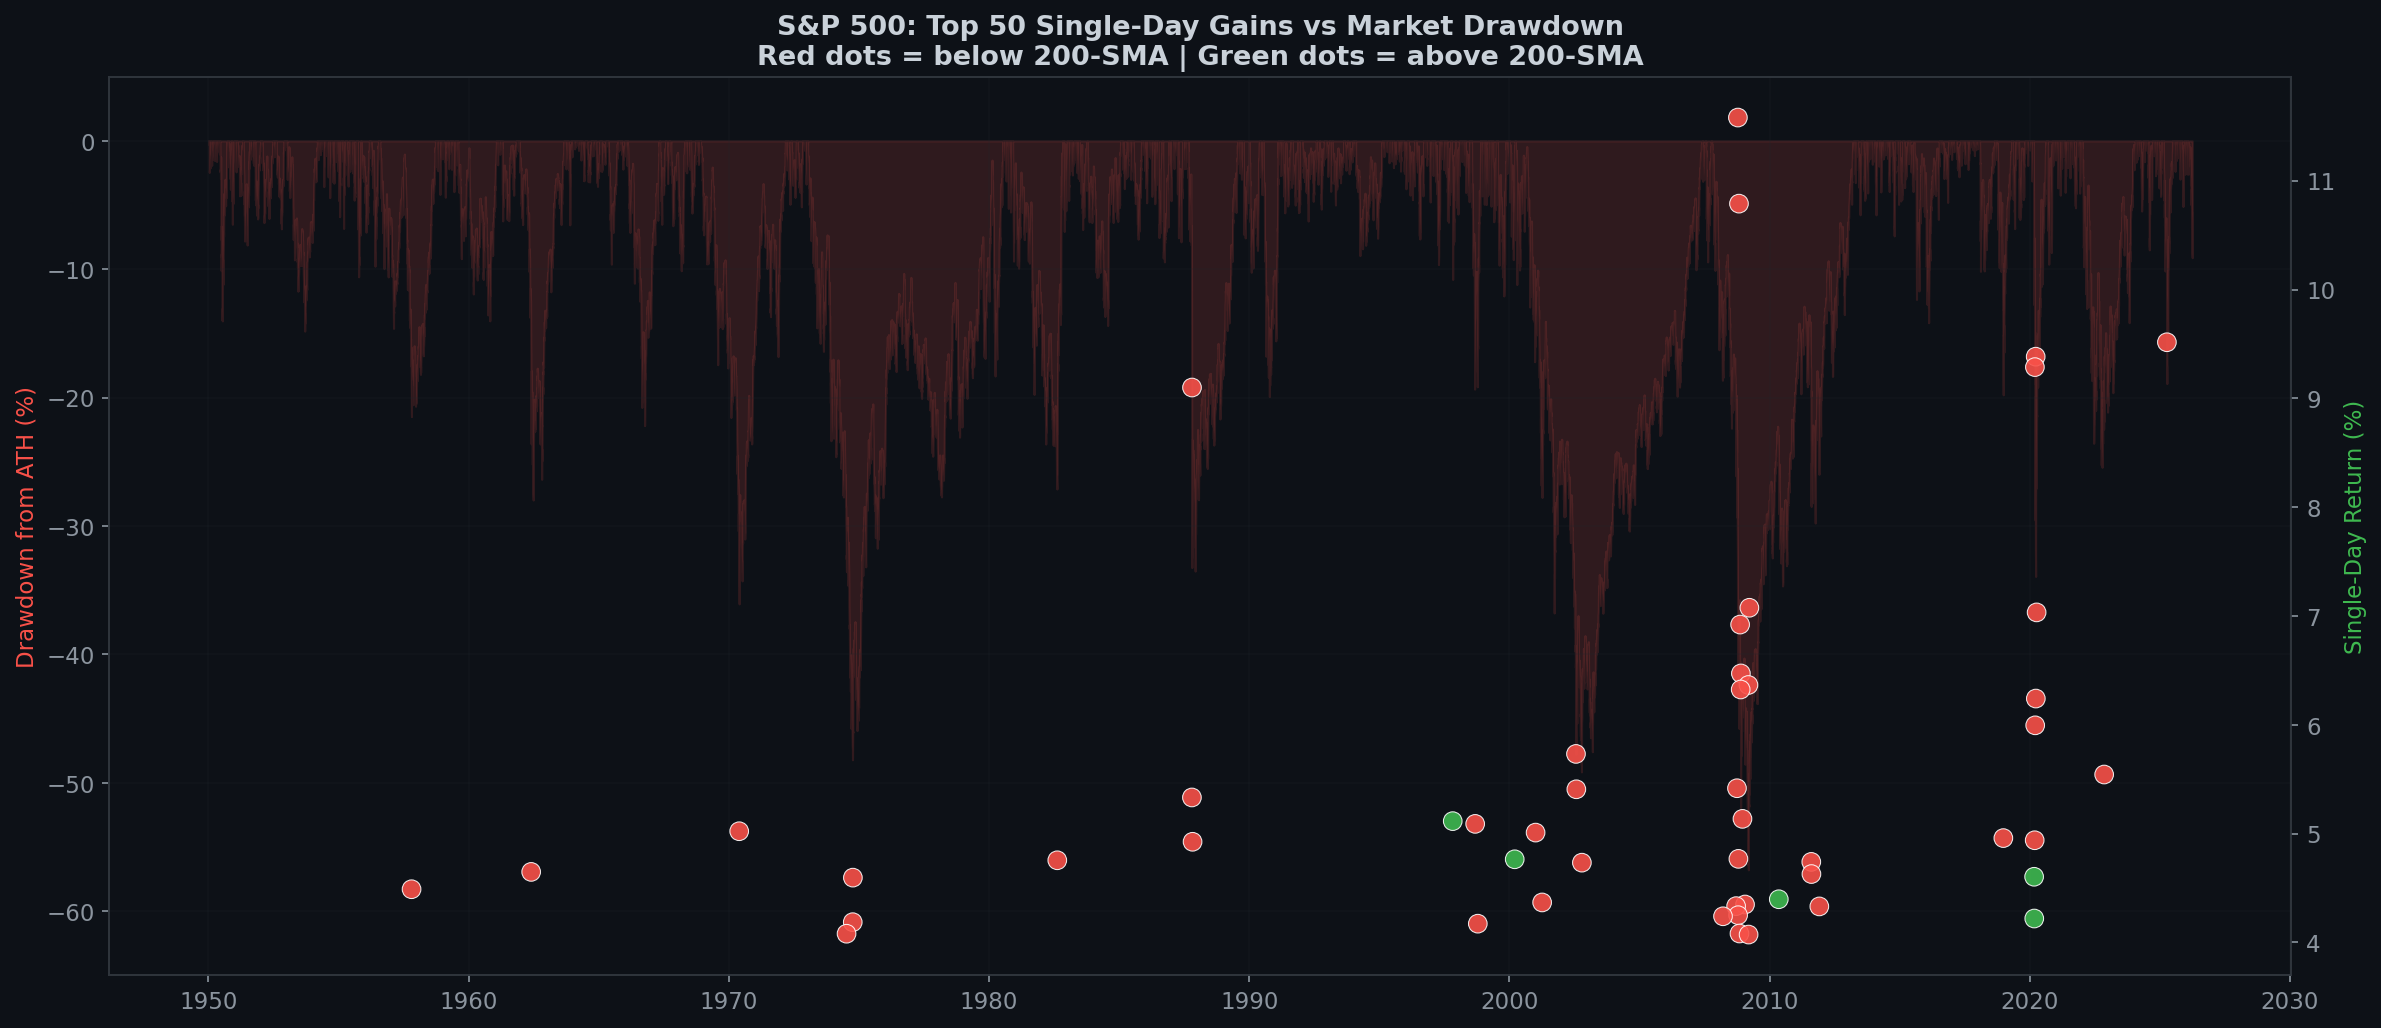
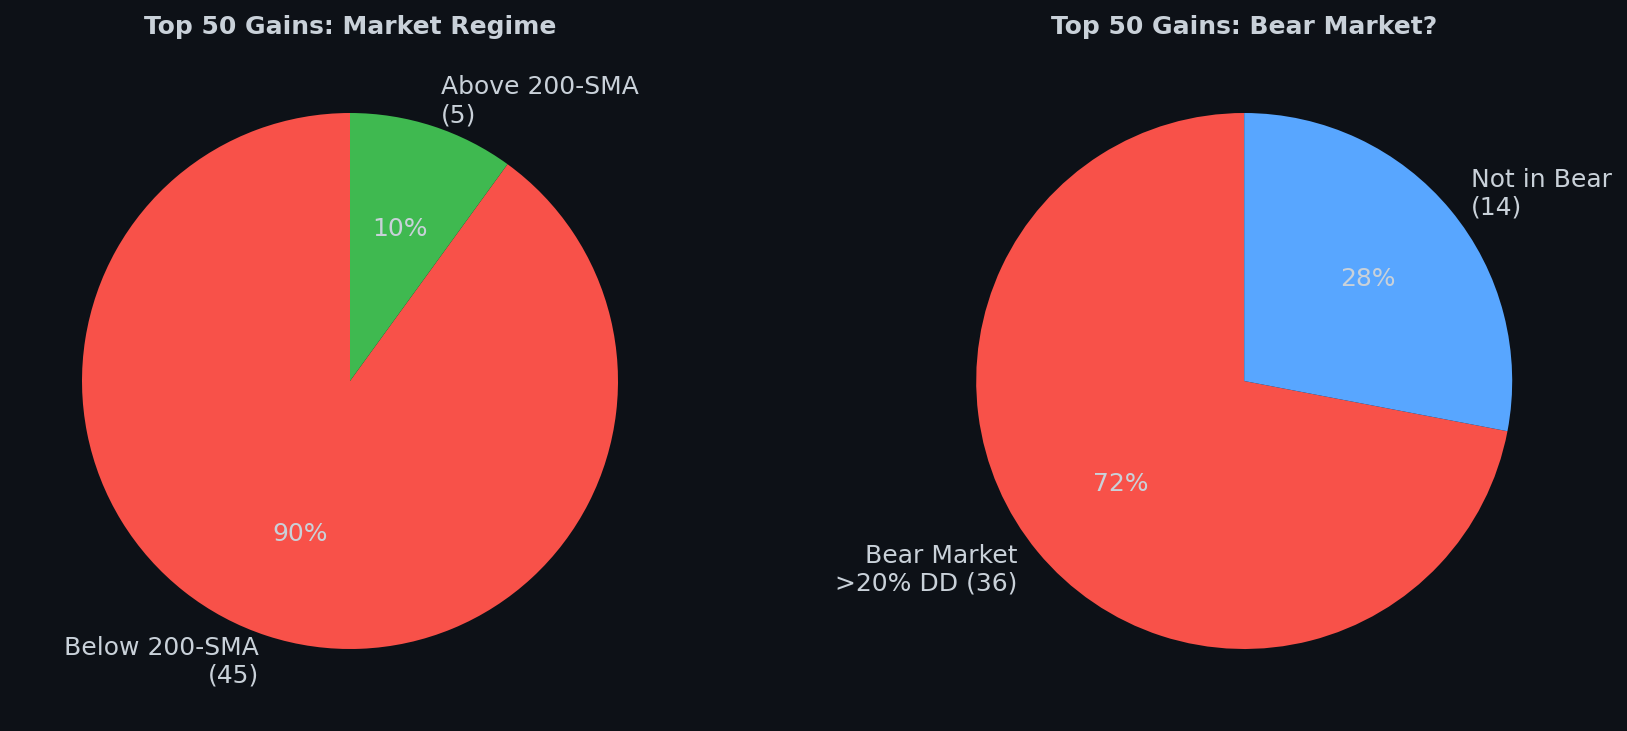
We pulled the 50 biggest single-day percentage gains in SPX history (going back to 1950), and the results are almost comically one-sided:
- 90% occurred when SPX was below its 200-day moving average
- 72% occurred during a bear market (>20% drawdown from all-time high)
- The average drawdown from ATH at the time of these “huge rallies” was -28.2%
The Top 20: A Hall of Pain
| # | Date | Return | Drawdown | Context |
|---|---|---|---|---|
| 1 | Oct 13, 2008 | +11.58% | -35.9% | Global Financial Crisis |
| 2 | Oct 28, 2008 | +10.79% | -39.9% | GFC — weeks before the real bottom |
| 3 | Apr 9, 2025 | +9.52% | -11.2% | Tariff war relief rally |
| 4 | Mar 24, 2020 | +9.38% | -27.7% | COVID crash |
| 5 | Mar 13, 2020 | +9.29% | -19.9% | COVID — before the real crash |
| 6 | Oct 21, 1987 | +9.10% | -23.3% | Two days after Black Monday |
| 7 | Mar 23, 2009 | +7.08% | -47.4% | The actual GFC bottom |
| 8 | Apr 6, 2020 | +7.03% | -21.3% | COVID dead cat bounce |
| 9 | Nov 13, 2008 | +6.92% | -41.8% | GFC |
| 10 | Nov 24, 2008 | +6.47% | -45.6% | GFC |
| 11 | Mar 10, 2009 | +6.37% | -54.0% | 13 days before the real bottom |
| 12 | Nov 21, 2008 | +6.32% | -48.9% | GFC |
| 13 | Mar 26, 2020 | +6.24% | -22.3% | COVID |
| 14 | Mar 17, 2020 | +6.00% | -25.3% | COVID |
| 15 | Jul 24, 2002 | +5.73% | -44.8% | Dot-com bust |
| 16 | Nov 10, 2022 | +5.54% | -17.5% | CPI surprise |
| 17 | Sep 30, 2008 | +5.42% | -25.5% | GFC |
| 18 | Jul 29, 2002 | +5.41% | -41.1% | Dot-com bust |
| 19 | Oct 20, 1987 | +5.33% | -29.7% | Day after Black Monday |
| 20 | Dec 16, 2008 | +5.14% | -41.7% | GFC |
All 20 occurred below the 200-day moving average. Every single one.
Why Does This Happen?
The mechanical reason: In volatile markets, daily price ranges expand dramatically. A stock that normally moves 0.5% per day might start moving 3-5% per day. This expands both the upside and downside extremes. The biggest up days and the biggest down days are siblings, not opposites.
The psychological reason: Massive rallies happen when fear reaches a breaking point. Short sellers cover. Bargain hunters pile in. Central banks announce emergency measures. The relief is explosive — but temporary. Because the fundamental problems that caused the crash haven’t been solved in 6.5 hours of trading.
October 13, 2008 — the biggest single-day gain ever — happened during the Global Financial Crisis. SPX rallied 11.58%. The market was down -35.9% from its all-time high. And it would go on to fall another 20% before bottoming in March 2009.
That +11.58% day? It was a pit stop on the way to hell, not a U-turn.
Where They Cluster
- 1950-1970: 3 events (20 years of boring, steady gains)
- 1970-1987: 7 events (inflation crisis era)
- 1987 Crash: 2 of the top 50 in just 2 trading days
- 1988-2000: 4 events (12 years of bull market = few extreme days)
- Dot-com bust: 5 events
- GFC (2008-2009): 12 events
- 2010-2020: 12 events (mostly COVID)
- 2021+: 2 events
The pattern is unmistakable: boring decades produce few extreme up days. Chaotic periods produce dozens.
The Boring Edge Takeaway
This is the thesis of our entire publication, crystallized in one chart:
The most exciting days in market history are the most dangerous.
If you see a +5% day and feel the urge to buy, pause. Look at where the market is relative to its 200-day moving average. Look at the drawdown from ATH. Chances are, you’re not buying a recovery — you’re buying a bounce inside a crash.
The real bull signals? They’re boring:
- Slow, steady advances above a rising 200-SMA
- Average daily moves of 0.3-0.5%
- Low VIX (below 15)
- No headline-worthy single days
When nothing exciting is happening, that’s when the compounding is happening. When everybody’s screaming “biggest gain in 90 days!” — that’s when the compounding has been interrupted.
Boring is the edge. Excitement is the tax.
Data: S&P 500, January 1950 – March 2026. Bear market defined as >20% drawdown from prior all-time high. 200-SMA calculated on daily closing prices.
 日本語
日本語 Español
 Português
 العربية
 繁體中文
繁體中文 简体中文
简体中文