Same +3% Day, Completely Different Outcome: The VIX Context Effect
Not all big up days are created equal. The VIX at the time of the rally tells you whether it’s a genuine recovery or a dead cat bounce.
The Missing Variable
In the previous posts, we treated all >2.85% up days the same. But there’s a crucial variable: How scared was the market when the rally happened?
A +3% day when VIX is at 20 is fundamentally different from a +3% day when VIX is at 45. Same green candle. Completely different context.
The Data Split
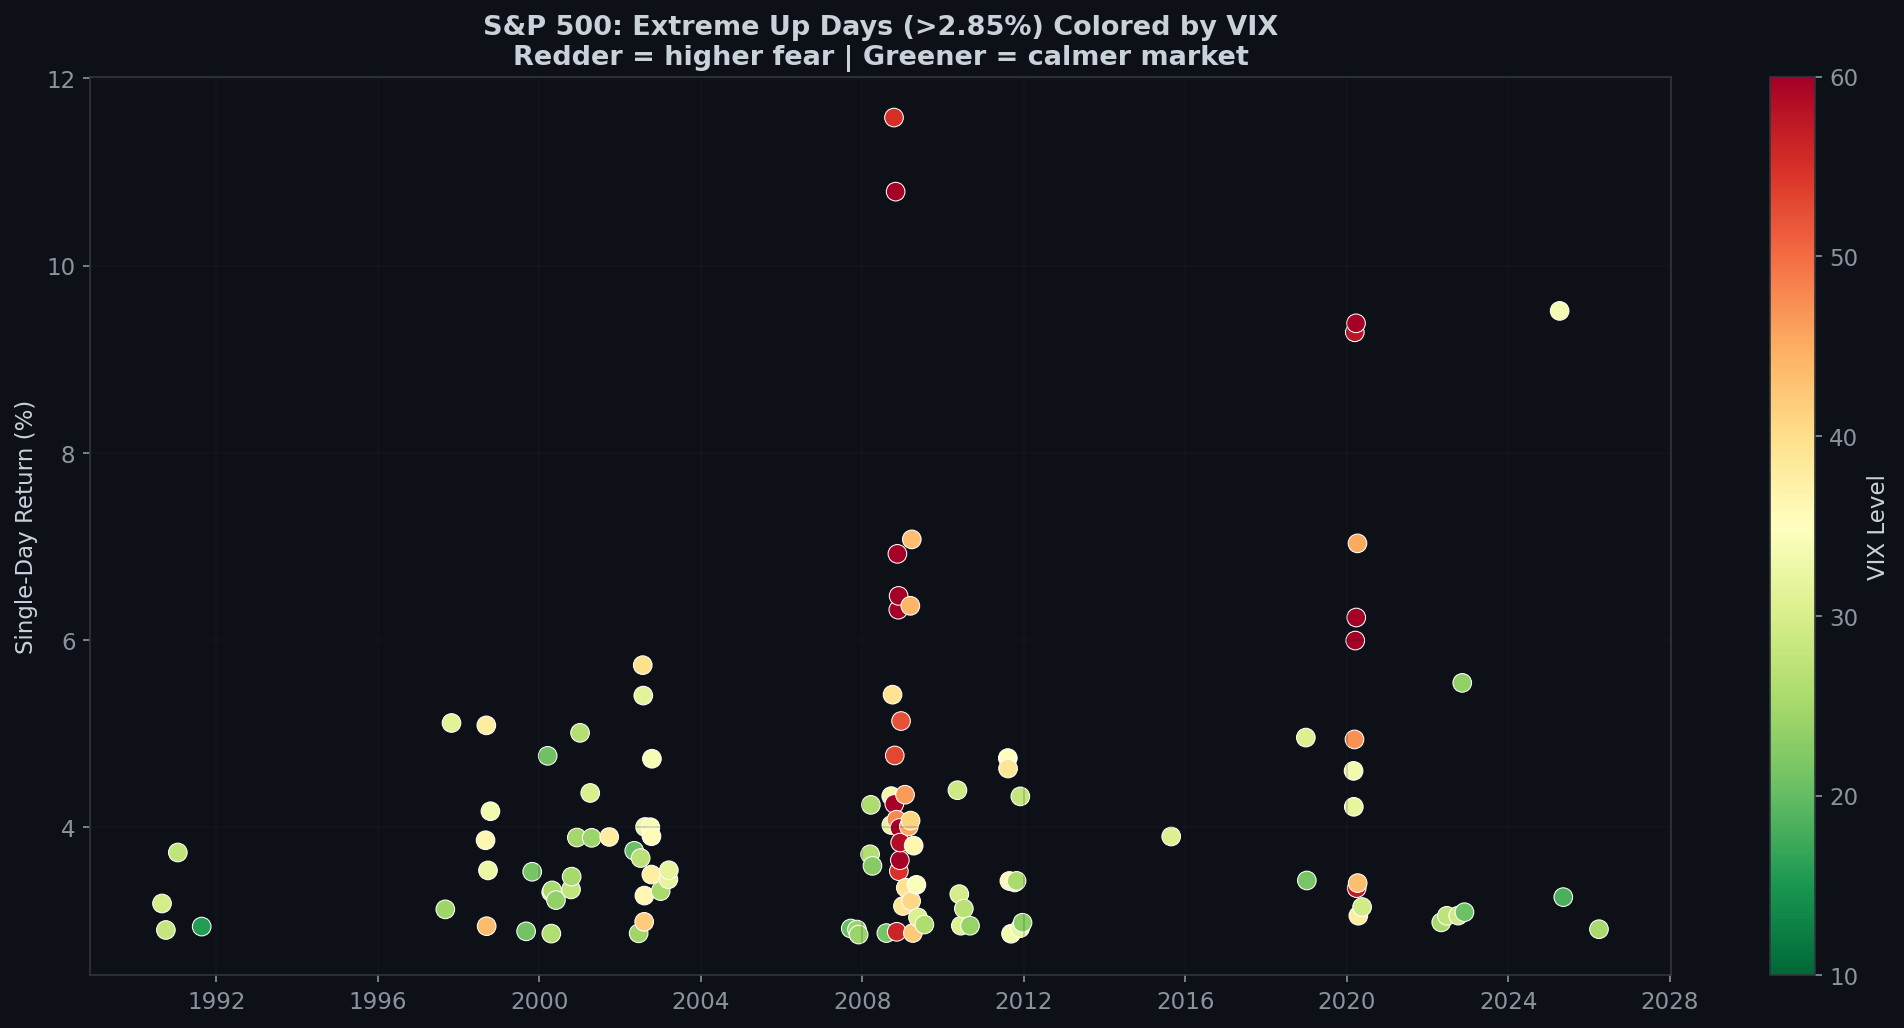
Since 1990 (when VIX data begins), there have been 114 trading days where SPX gained more than 2.85%:
- VIX ≥ 25 (High Fear): 93 events — Average VIX: 39.0
- VIX < 25 (Low Fear): 21 events — Average VIX: 22.1
82% of extreme up days happen when VIX is above 25.
The Surprise: High-Fear Rallies Work Better Long-Term
| Period | VIX ≥ 25 | VIX < 25 | Spread |
|---|---|---|---|
| 1 Day | -0.57% | +0.15% | -0.72% |
| 5 Days | -0.96% | +0.31% | -1.28% |
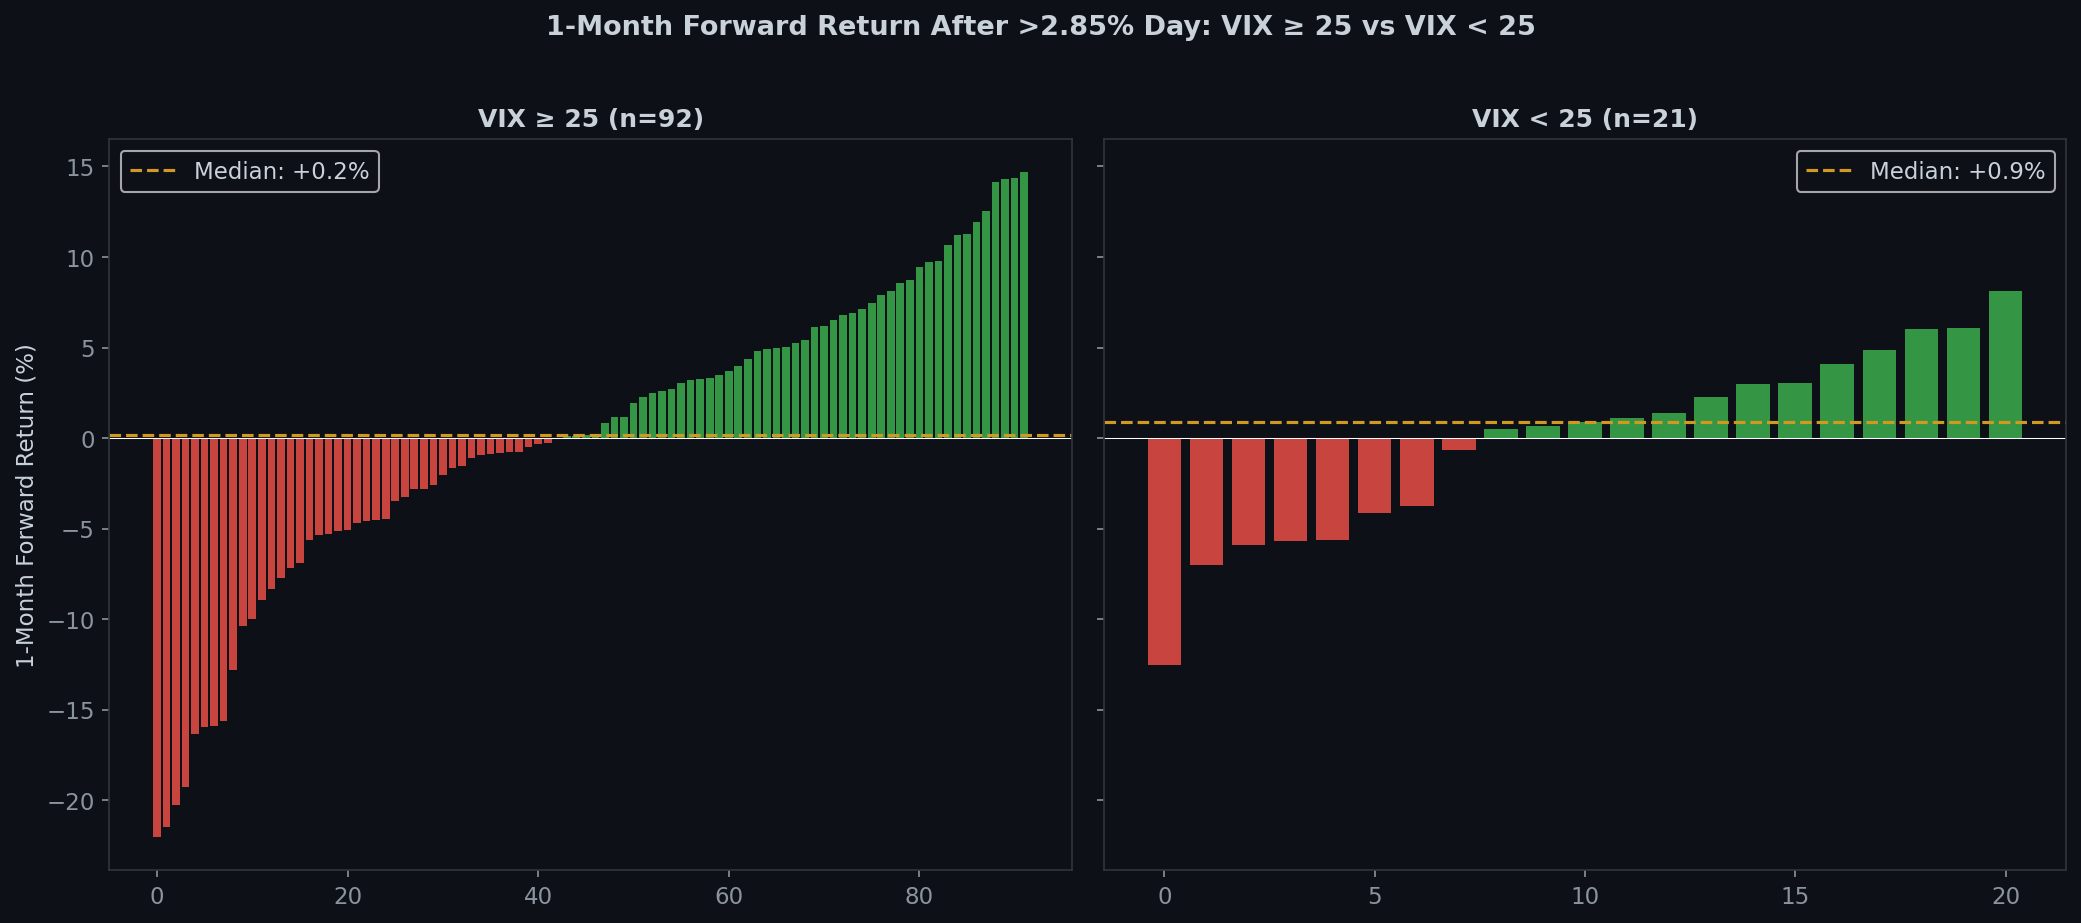
| 1 Month | +0.09% | -0.15% | +0.25% |
| 3 Months | +3.13% | -1.41% | +4.54% |
When VIX ≥ 25 and SPX rallies >2.85%, you’re up 3.13% three months later on average.
When VIX < 25 and SPX rallies >2.85%, you’re DOWN 1.41% three months later.
That’s a 4.54 percentage point spread.
Win rates confirm: 3M win rate is 63% for high-VIX rallies vs. only 48% for low-VIX rallies.
Why Does This Happen?
High-VIX rallies happen at better prices. When VIX is at 40, the market has already crashed. You’re buying at depressed levels. Even if the rally is a dead cat bounce, the statistical edge of buying low kicks in over 3 months.
Low-VIX rallies happen at stretched prices. When VIX is at 20 and SPX jumps 3%, the market was already calm and probably expensive. There’s no mean-reversion tailwind.
A +3% day at VIX 40 means “things were terrible and got slightly less terrible.” A +3% day at VIX 20 means “things were fine and just got euphoric.” The first has room to recover. The second is likely to give back the gains.
The Short-Term Pain Is Universal
At 1-day and 5-day horizons, both groups lose money. The high-VIX group actually does worse short-term (-0.57% next day). The whipsaws in high-VIX environments are brutal.
The edge only appears at 1 month+ when the initial volatility settles and fundamental value begins to matter.
Next-Day Reversal Stats (Bonus)
After any >2.85% up day (all 152 instances since 1950):
- Next-day reversal rate: 47.7%
- Average next-day return: -0.14%
- Next day drops >1%: 27.2% of the time
- Back-to-back >2.85% days: Only 8 times (5.3%)
The Unified Framework
Across all four posts in this series:
- Big up days are volatility events, not directional signals
- The biggest rallies happen in the worst markets
- Breaking calm predicts more volatility, not direction
- Context matters: high-VIX rallies > low-VIX rallies at 3 months
The synthesis: the scariest rallies — when VIX is high, drawdowns are deep, everyone is terrified — are paradoxically the ones with the best long-term outcomes. But only if you survive the next month of whipsaws.
The exciting moment (today’s +2.9%) is not the opportunity. The boring, disciplined follow-through over the next 3 months — that’s where the edge lives.
Data: S&P 500, January 1990 – March 2026. VIX levels are same-day closing values. Forward returns calculated from closing prices.
 日本語
日本語 Español
 Português
 العربية
 繁體中文
繁體中文 简体中文
简体中文