
The Asymmetry of Fear: A -2.5% Day and a +2.5% Day Tell Completely Different Stories
A 2.5% drop and a 2.5% gain are mirror images in magnitude. But in the market’s vocabulary, they mean entirely different things — and the forward returns prove it.
The Setup
Here’s a thought experiment. The S&P 500 moves 2.5% in a single day. Does it matter which direction?
Intuitively, most people would say yes — a big drop is “bad” and a big gain is “good.” But ask a quant, and the answer is more nuanced. Both are extreme events. Both signal elevated volatility. Both are rare.
So we ran the numbers. We pulled every day since 1950 where SPX moved ≥2.5% in either direction, and compared the forward returns.
The results expose one of the market’s deepest asymmetries.
The Raw Numbers
Since 1950:
- SPX gained ≥2.5% in a single day: 218 times
- SPX dropped ≥2.5% in a single day: 236 times
Crashes happen slightly more often than surges. Markets take the stairs up and the elevator down — this is already asymmetric.
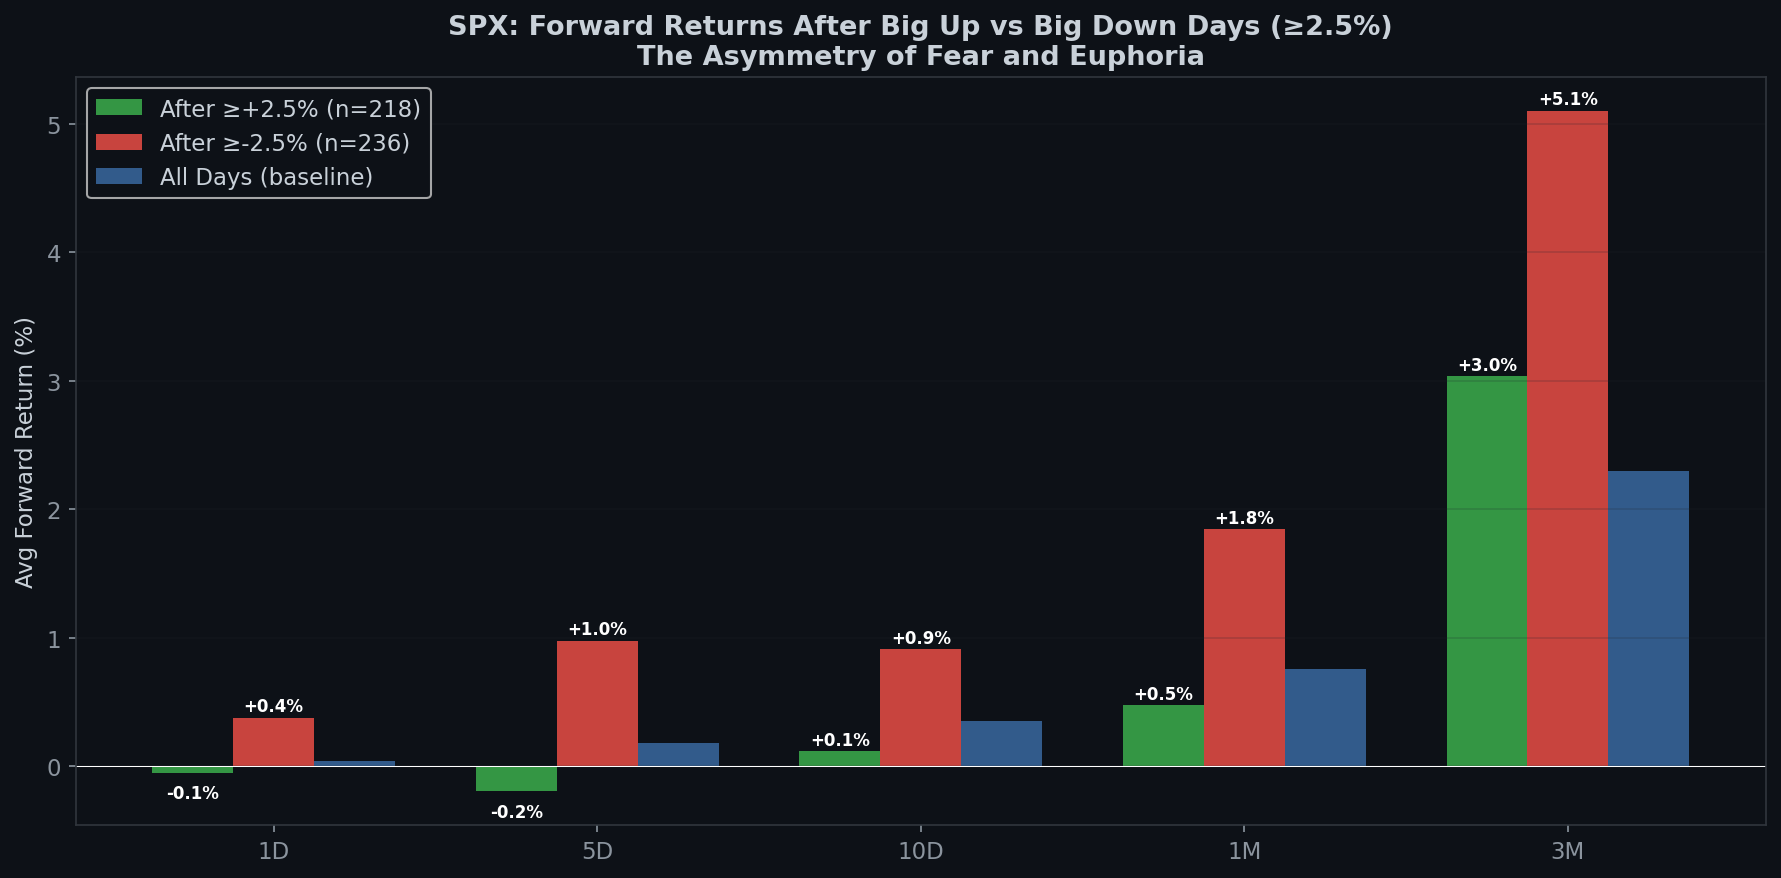
| Period | After ≥+2.5% Day | After ≥-2.5% Day | Baseline (All Days) |
|---|---|---|---|
| 1 Day | -0.05% | +0.38% | +0.04% |
| 5 Days | -0.19% | +0.98% | +0.18% |
| 10 Days | +0.12% | +0.91% | +0.36% |
| 1 Month | +0.47% | +1.85% | +0.76% |
| 3 Months | +3.04% | +5.10% | +2.30% |
After a ≥2.5% crash, the S&P 500 averages +1.85% over the next month. That’s 2.4x the baseline return. And over 3 months, it averages +5.10% — more than double the baseline.
Now look at big up days: +0.47% at 1 month. That’s actually below the baseline of +0.76%. You’d have been better off buying on a random Tuesday.
Big down days are buying opportunities. Big up days are not.
Win Rates: The Asymmetry Deepens
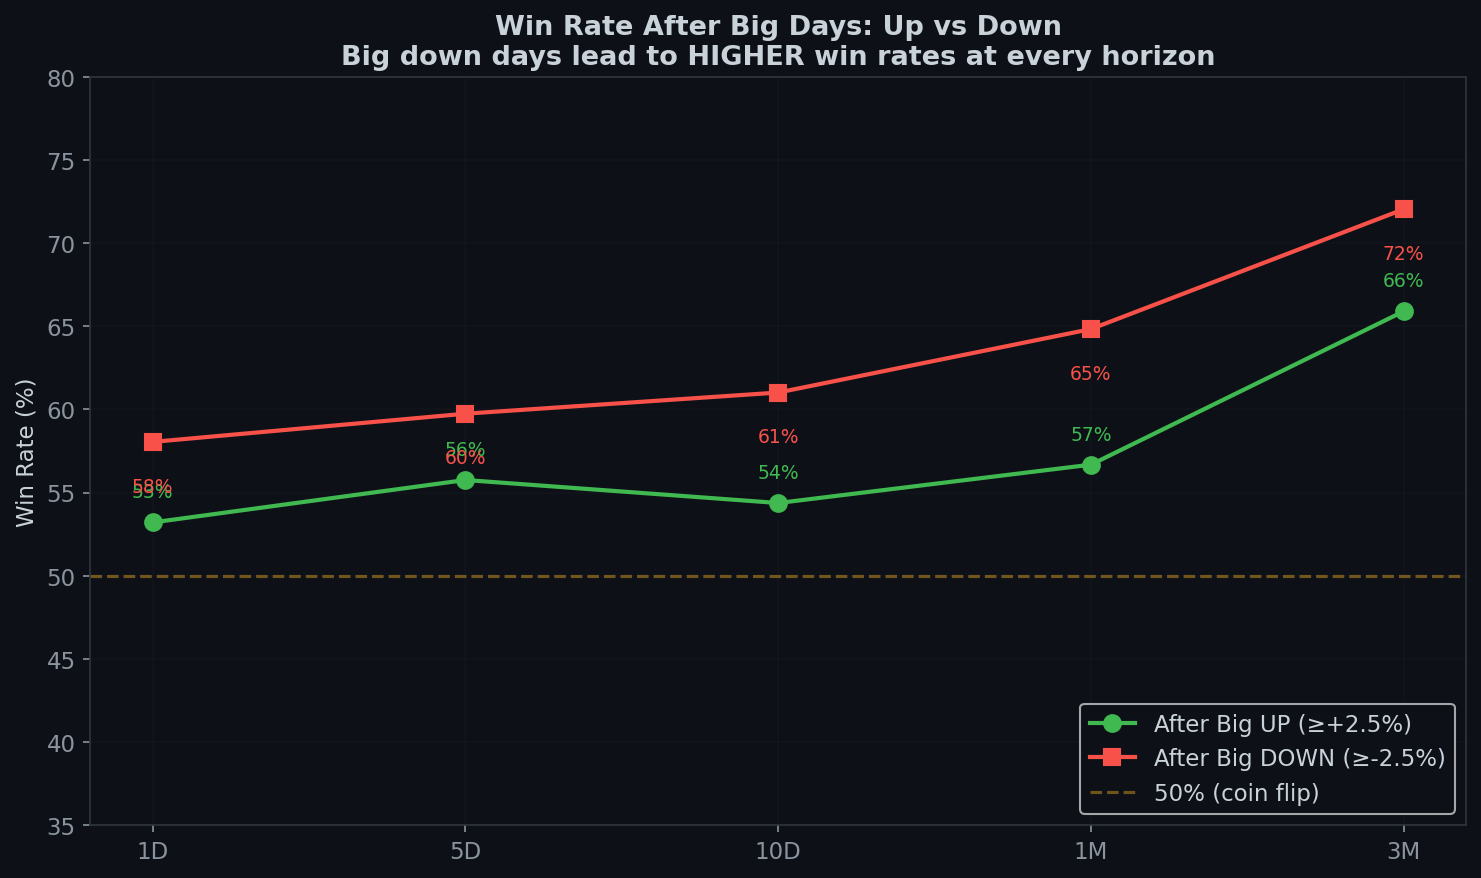
| Period | After Big UP | After Big DOWN |
|---|---|---|
| 1 Day | 53% | 58% |
| 5 Days | 56% | 60% |
| 1 Month | 57% | 65% |
| 3 Months | 66% | 72% |
After a big down day, you have a 65% chance of being positive at 1 month and a 72% chance at 3 months. After a big up day, those numbers drop to 57% and 66%.
The win rate gap at 1 month is 8 percentage points. That’s not noise. That’s a structural edge.
Next-Day Reversal: The Market’s Reflex
The asymmetry starts immediately:
- After a big UP day: 47% chance of being down the next day. Average next-day return: -0.05%.
- After a big DOWN day: 58% chance of being up the next day. Average next-day return: +0.38%.
The market has a stronger mean-reversion reflex after drops than after surges. When it crashes, it tends to bounce. When it surges, it doesn’t tend to crash — but it also doesn’t tend to follow through.
This makes intuitive sense. Big drops trigger:
- Short covering (forced buying)
- Value buyers stepping in
- Fed/policy response expectations
- Technical support bounces
Big surges trigger:
- Profit-taking
- Skepticism (“is this real?”)
- No forced buying — just fading enthusiasm
Volatility: Fear Is Louder Than Greed
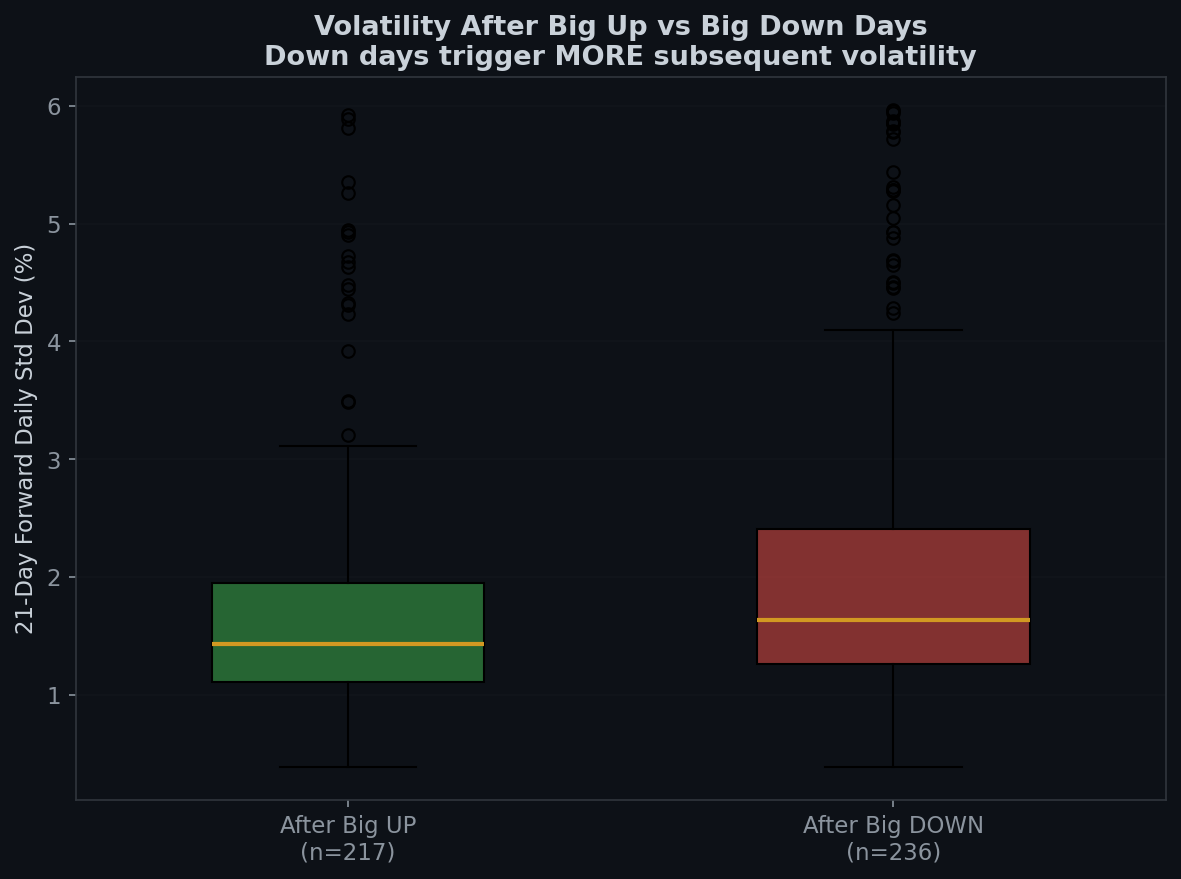
21-day forward volatility (daily standard deviation):
- After big UP: 1.75%
- After big DOWN: 2.10%
After a crash, the next month is 20% more volatile than after a surge. This is the volatility asymmetry at work — drops create fear, fear creates uncertainty, uncertainty creates more volatility.
This is important for position sizing. Even though big down days have better forward returns, they also have higher forward volatility. The opportunity is real, but so is the turbulence.
Why This Happens: The Psychology
1. Crashes create bargains. After a -2.5% day, stocks are literally cheaper. If nothing fundamentally changed, the expected return going forward should be higher.
2. Surges create expensive prices. After a +2.5% day, stocks are more expensive. If the gain was driven by sentiment rather than fundamentals, reversion is likely.
3. Fear is sharper than greed. Behavioral finance shows that losses feel ~2x more painful than equivalent gains feel good (prospect theory). This means sell-offs are faster and more violent — which creates more overshooting — which creates better buying opportunities.
4. Crashes cluster; surges don’t. Big down days tend to happen near other big down days (volatility clustering). This means you’re often buying in a storm. But that’s precisely where the returns are.
The Counterintuitive Framework
| Event | Your Emotion | The Data Says |
|---|---|---|
| SPX drops 2.5%+ | Panic, sell | Buy. Forward returns are 2.4x baseline |
| SPX surges 2.5%+ | Euphoria, buy | Hold. Forward returns are below baseline |
| Big drop → next day bounce | Relief, chase | You’re late. Best entry was Day 0 |
| Big drop → 2 consecutive up days | “It’s over” | Cautiously agree. 82% WR at 5 days |
Every arrow points in the same direction: the market rewards you for doing the uncomfortable thing.
The Boring Edge Takeaway
- Big down days produce better forward returns than big up days — at every time horizon from 1 day to 3 months. The spread at 1 month is +1.85% vs +0.47%.
- The win rate gap is 8 points at 1 month (65% vs 57%). This is a genuine statistical edge, not noise.
- Volatility is higher after drops. The better returns come with more turbulence. This is the price of the edge.
- The synthesis: Boring Edge exists because the market systematically underprices discomfort and overprices excitement. Every data point in this series confirms it. The most boring, uncomfortable, un-tweetable moments in markets are where the returns live.
This analysis covers 19,182 trading days from January 1950 to April 2026. Forward returns use close-to-close prices. Baseline calculated from every 5th trading day. This is not financial advice.
Previous: Two Green Days After a Crash — The Rarest Recovery Signal
Methodology: “Big up day” = SPX close ≥+2.5% vs prior close. “Big down day” = SPX close ≥-2.5% vs prior close. Forward returns from event day close. Volatility measured as standard deviation of daily returns over the subsequent 21 trading days. Win rate = percentage with positive forward returns. All data from Yahoo Finance (^GSPC).
 日本語
日本語 Español
 Português
 العربية
 繁體中文
繁體中文 简体中文
简体中文