Two Green Days After a Crash — The Rarest Recovery Signal
SPX crashed, bounced, then bounced again. This “double bounce” only happens 28% of the time — and when it does, the forward returns are dramatically different from every other scenario.
The Setup
Most market commentary focuses on the crash or the bounce. But here’s the question almost nobody thinks to ask:
What happens when SPX crashes ≥2.5%, bounces the next day, and then bounces again the day after?
We scanned 236 crash events since 1950 and sorted them into three groups based on what happened in the 48 hours after impact.
The Three Paths After a Crash
When SPX drops ≥2.5% in a single session, the next two trading days follow one of three patterns:
- Double Bounce (D1 ↑, D2 ↑): 68 times — 28%
- Single Bounce (D1 ↑, D2 ↓): 69 times — 29%
- No Bounce (D1 ↓): 99 times — 42%
Almost half the time (42%), the market doesn’t even bounce at all the next day. It just keeps falling.
When it does bounce, it’s roughly a coin flip whether Day 2 continues the recovery (28%) or gives back the gains (29%).
But here’s what matters: these three groups have wildly different forward returns.
The Data

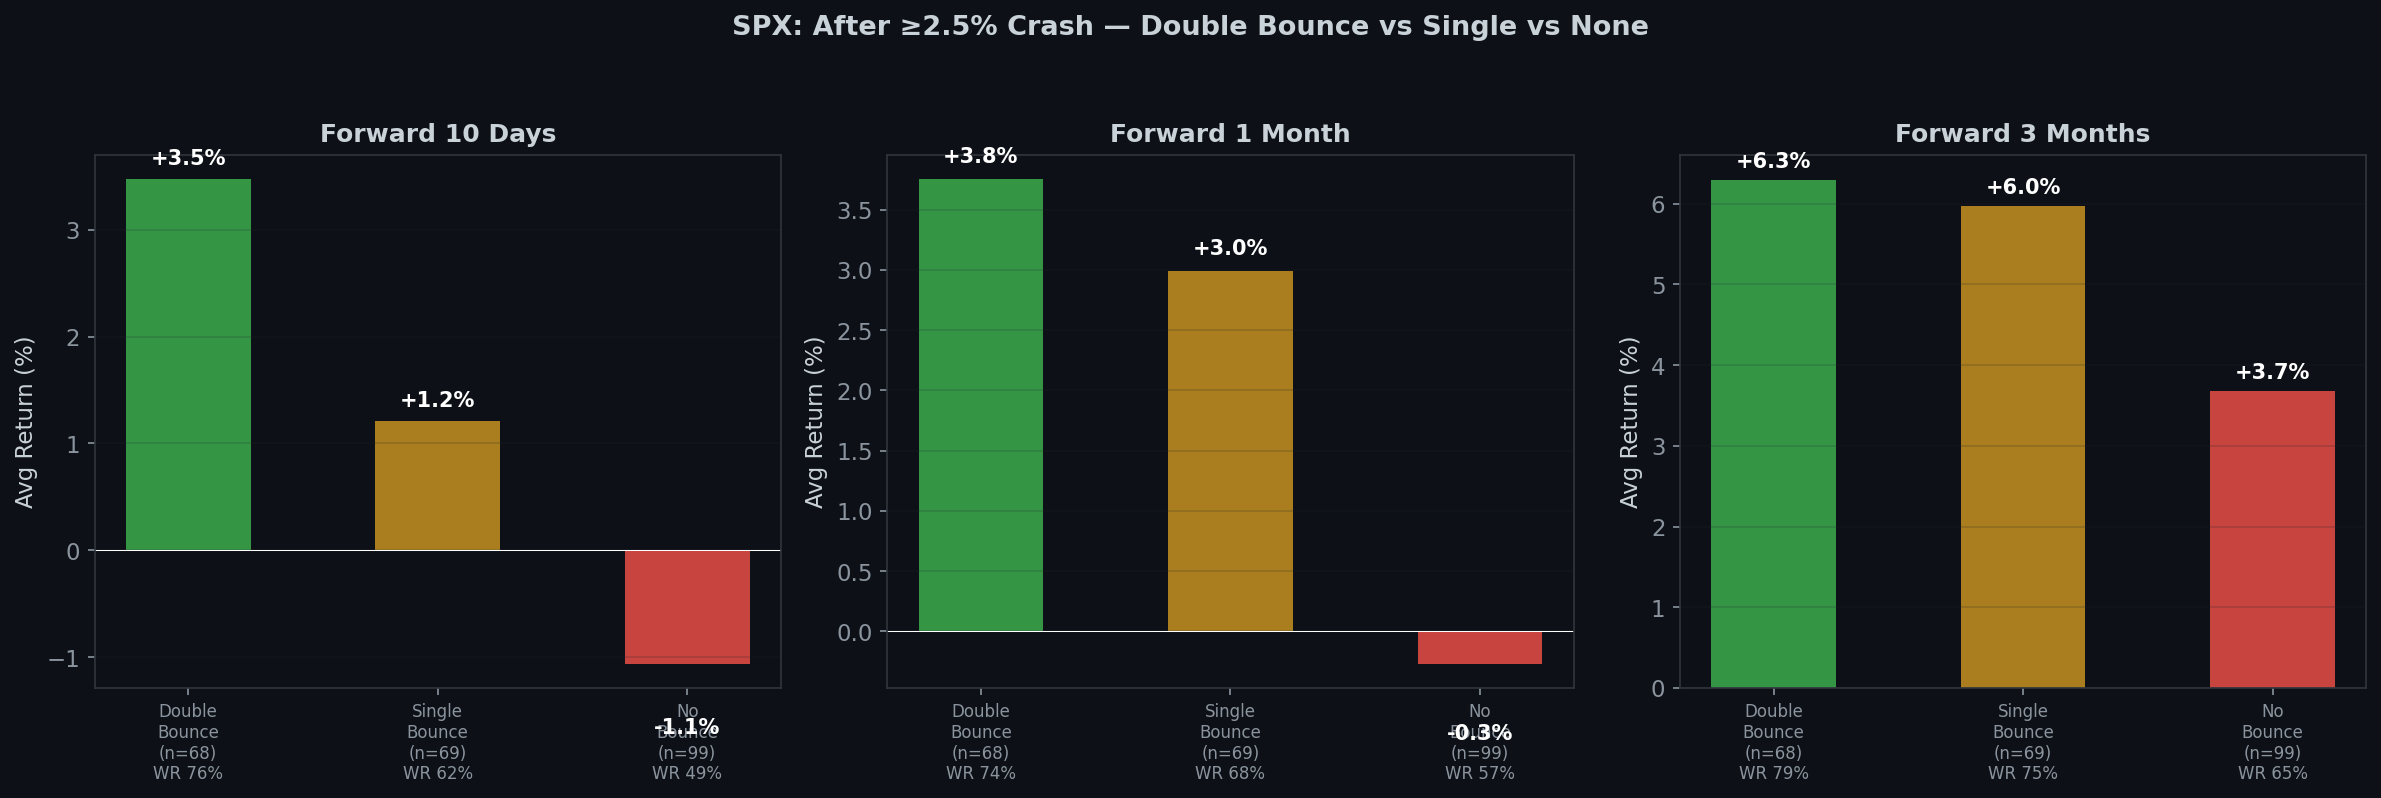
| Period | Double Bounce (n=68) | Single Bounce (n=69) | No Bounce (n=99) |
|---|---|---|---|
| 5 Days | +3.39% (WR 82%) | +0.99% (WR 59%) | -0.69% (WR 44%) |
| 10 Days | +3.48% (WR 76%) | +1.21% (WR 62%) | -1.06% (WR 49%) |
| 1 Month | +3.76% (WR 74%) | +2.99% (WR 68%) | -0.27% (WR 57%) |
| 3 Months | +6.29% (WR 79%) | +5.97% (WR 75%) | +3.68% (WR 65%) |
The double bounce group dominates at every time horizon.
At 5 days out, the win rate is 82% — that’s as close to a sure thing as you get in markets. The average return of +3.39% in just one week is extraordinary.
What Makes the Double Bounce Special?
The mechanism is intuitive once you see it:
Crash → No Bounce = selling pressure hasn’t exhausted itself. There are still sellers. The market needs more time — or more pain — to find a floor.
Crash → Single Bounce → Down = the bounce was a dead cat. Buyers showed up for one day, tested the waters, and retreated. Not enough conviction.
Crash → Double Bounce = genuine buying conviction. Two consecutive days of positive returns after a crash means buyers are showing up, and they’re not leaving. This doesn’t guarantee a bottom, but it dramatically tilts the odds.
The Day 3 Surprise
Here’s a subtle detail: after a double bounce, what happens on Day 3?
Average: +0.03%. Win rate: 47%.
Day 3 is essentially a coin flip. The double bounce’s predictive power is in the 1-3 month horizon, not the next 24 hours.
Individual Instances
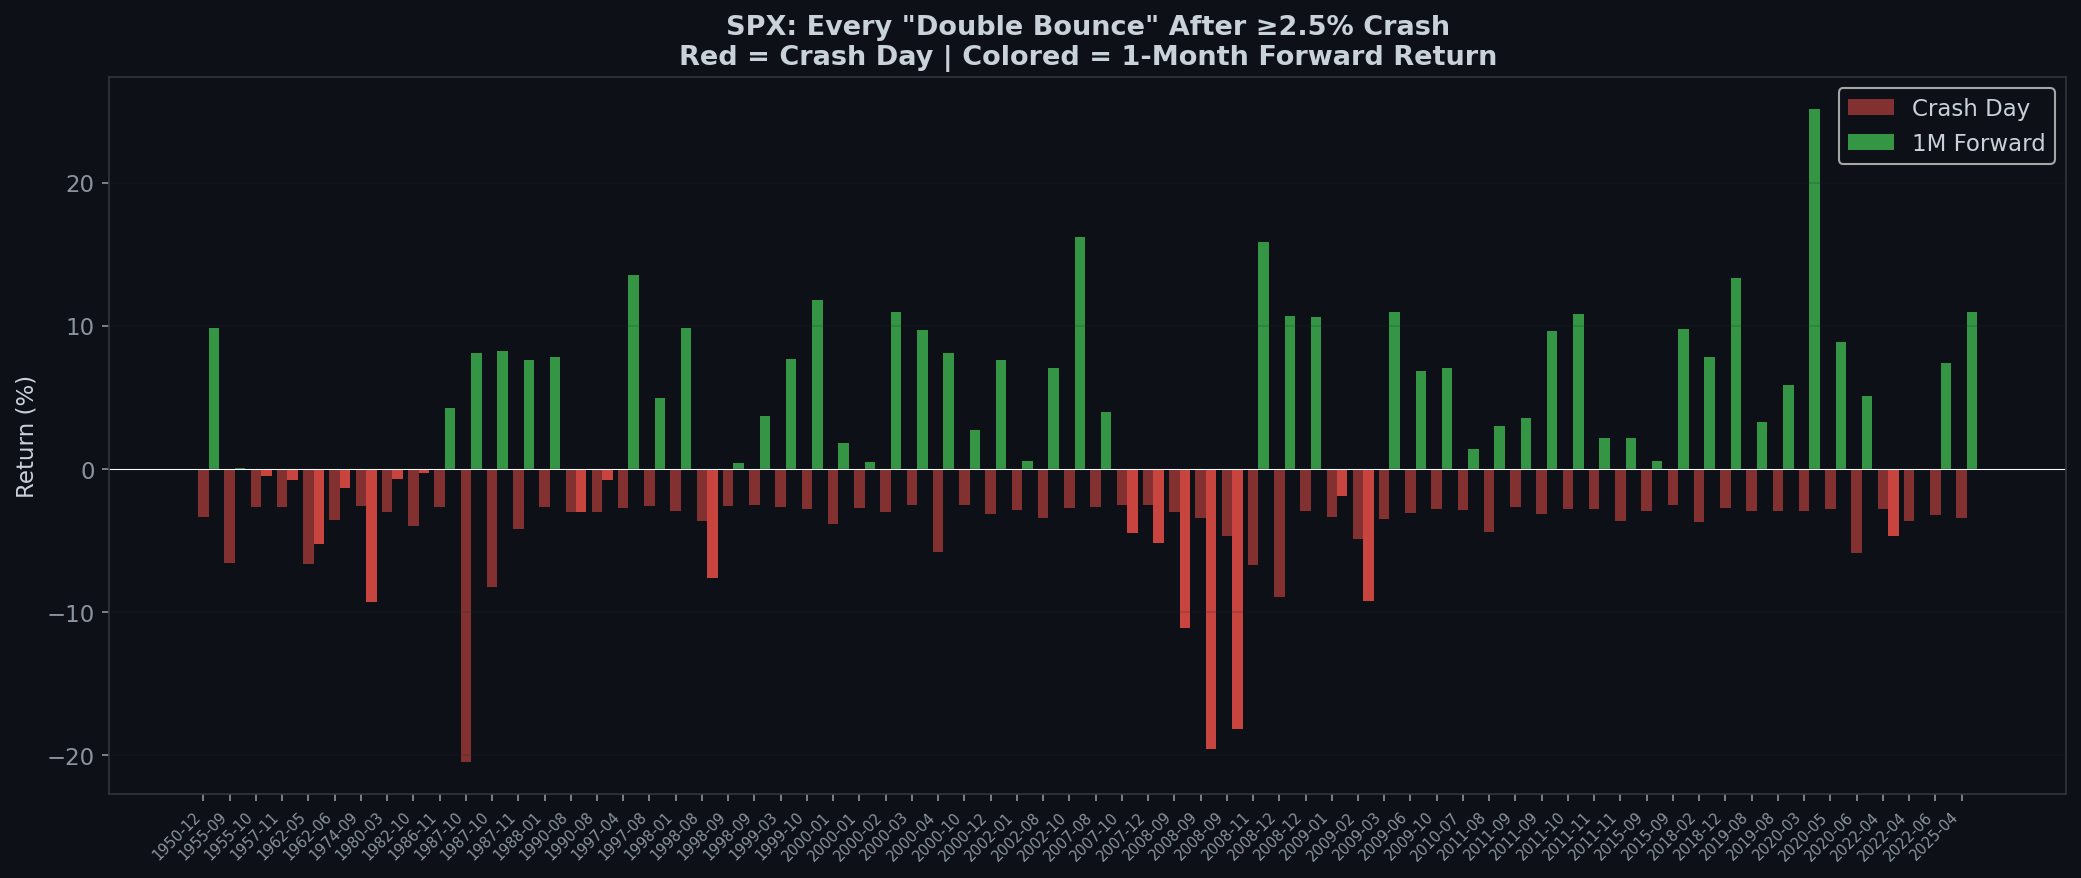
| Date | Crash | D1 | D2 | 1-Month Forward |
|---|---|---|---|---|
| 2020-03-23 | -2.9% | +9.4% | +1.2% | +14.4% |
| 2020-10-28 | -3.5% | +1.2% | +0.6% | +9.9% |
| 2025-04-10 | -3.5% | +1.8% | +0.8% | +9.0% |
| 2018-12-24 | -2.7% | +5.0% | +0.9% | +8.0% |
| 2018-02-08 | -3.8% | +1.5% | +1.4% | +6.2% |
| 2024-08-05 | -3.0% | +1.0% | +1.8% | +5.3% |
The March 23, 2020 double bounce was the actual COVID bottom. December 24, 2018 was the Christmas Eve bottom. These aren’t random — double bounces tend to mark genuine turning points.
The 48-Hour Rule
Based on this data, here’s a simple framework:
After a ≥2.5% crash:
- Two consecutive green days → 74-82% chance of being positive at 5 days through 3 months.
- One green day, then one red → Moderate signal. 1-month returns decent (+2.99%) but less reliable (68% WR).
- Red the next day → Patience. The market probably hasn’t found its floor yet.
This isn’t a trading system. It’s a framework for calibrating your expectations. The first 48 hours after a crash contain genuine information about what comes next.
The Boring Edge Takeaway
- The double bounce is rare but powerful. Only 28% of crashes produce two consecutive up days — but when they do, the 5-day win rate is 82%.
- It’s a conviction test, not a pattern trade. Two green days mean buyers have real conviction. One green day means nothing yet.
- Day 3 is noise. The signal lives in the 1-3 month horizon.
- Current situation: On March 31, SPX rebounded +2.91% after a multi-day decline. On April 1, it added another +0.72%. By this framework, the 48-hour signal is cautiously optimistic — though the original decline was spread over multiple days rather than a single crash, making this a looser analog than the purest historical examples.
This analysis covers 19,182 trading days from January 1950 to April 2026. Forward returns use close-to-close prices. This is not financial advice.
Previous: SPX Crashed and Bounced — Dead Cat or Real Recovery?
Next: The Asymmetry of Fear: Why Down Days and Up Days Tell Different Stories
Methodology: A “crash” is defined as SPX closing ≥2.5% lower than the prior day. “Double bounce” = Day 1 and Day 2 both close positive after the crash. Forward returns from crash day close. Sample: 236 crash days since January 1950.
 日本語
日本語 Español
 Português
 العربية
 繁體中文
繁體中文 简体中文
简体中文