Bitcoin 50-Day SMA Strategy Backtest — Faster Trend Following (2017-2026)
The 200-day SMA is the classic trend filter — but what if you used a faster one? We tested the 50-day Simple Moving Average on Bitcoin using 8.5 years of real Binance data. The result: CAGR of 44.6% (beating Buy & Hold’s 39.2%), a massive 13.5x win/loss ratio, and a total return of +2,170% — all while being in the market only 49% of the time. The 50 SMA dramatically outperforms the 200 SMA (26.1% CAGR) by catching more mid-term trends.
Key Takeaways
- 50-Day SMA generates CAGR 44.6% vs Buy & Hold 39.2% — strategy beats Buy & Hold by 5.4%
- Total return: +2,170% ($10k → $227k) vs Buy & Hold +1,541%
- Maximum drawdown: -57.5% vs Buy & Hold -83.2% — 26 points less pain
- 82 trades in 8.5 years (about 10 per year) — moderately active
- Win rate: 23.2% — wins only 1 in 4, but wins are enormous
- Win/Loss ratio: 13.5x — average win +48.1% vs average loss -3.6%
- Time in market: 49.1% — roughly half the time in cash
- Crushes the 200 SMA (26.1% CAGR) — faster SMA captures more Bitcoin cycles
What Is the 50-Day SMA Strategy?
The Simple Moving Average (SMA) is the most fundamental technical indicator in existence. It smooths out price noise by averaging the closing prices over a fixed number of days. The 50-day SMA sits between the fast (20-day) and slow (200-day) moving averages, making it ideal for capturing medium-term trends.
While the 200-day SMA is the go-to for long-term trend filtering, it reacts slowly — by the time it signals, you’ve often missed the first 20-30% of a move. The 50-day SMA responds much faster, entering trends earlier and exiting sooner when they reverse. The tradeoff: more false signals in choppy markets.
For Bitcoin, with its violent multi-month trends, a faster SMA can be a significant advantage.
Strategy Rules
Parameters:
- Moving Average: 50-day Simple Moving Average (SMA)
- Asset: BTC/USDT (Binance daily candles)
- Position: 100% long or 100% cash (long only)
- Transaction fee: 0.05% per side (0.1% round trip)
Buy Signal: Close price crosses above the 50-day SMA (price was below SMA yesterday, and is above SMA today).
Sell Signal: Close price crosses below the 50-day SMA (price was above SMA yesterday, and is below SMA today).
Why crossover, not just “above/below”? We use actual crossover signals rather than just checking if price is above the SMA. This prevents re-entering on every single day during a trend and creates cleaner entry/exit points. When price is hugging the SMA during consolidation, this generates more whipsaws — the cost of faster entries during real breakouts.
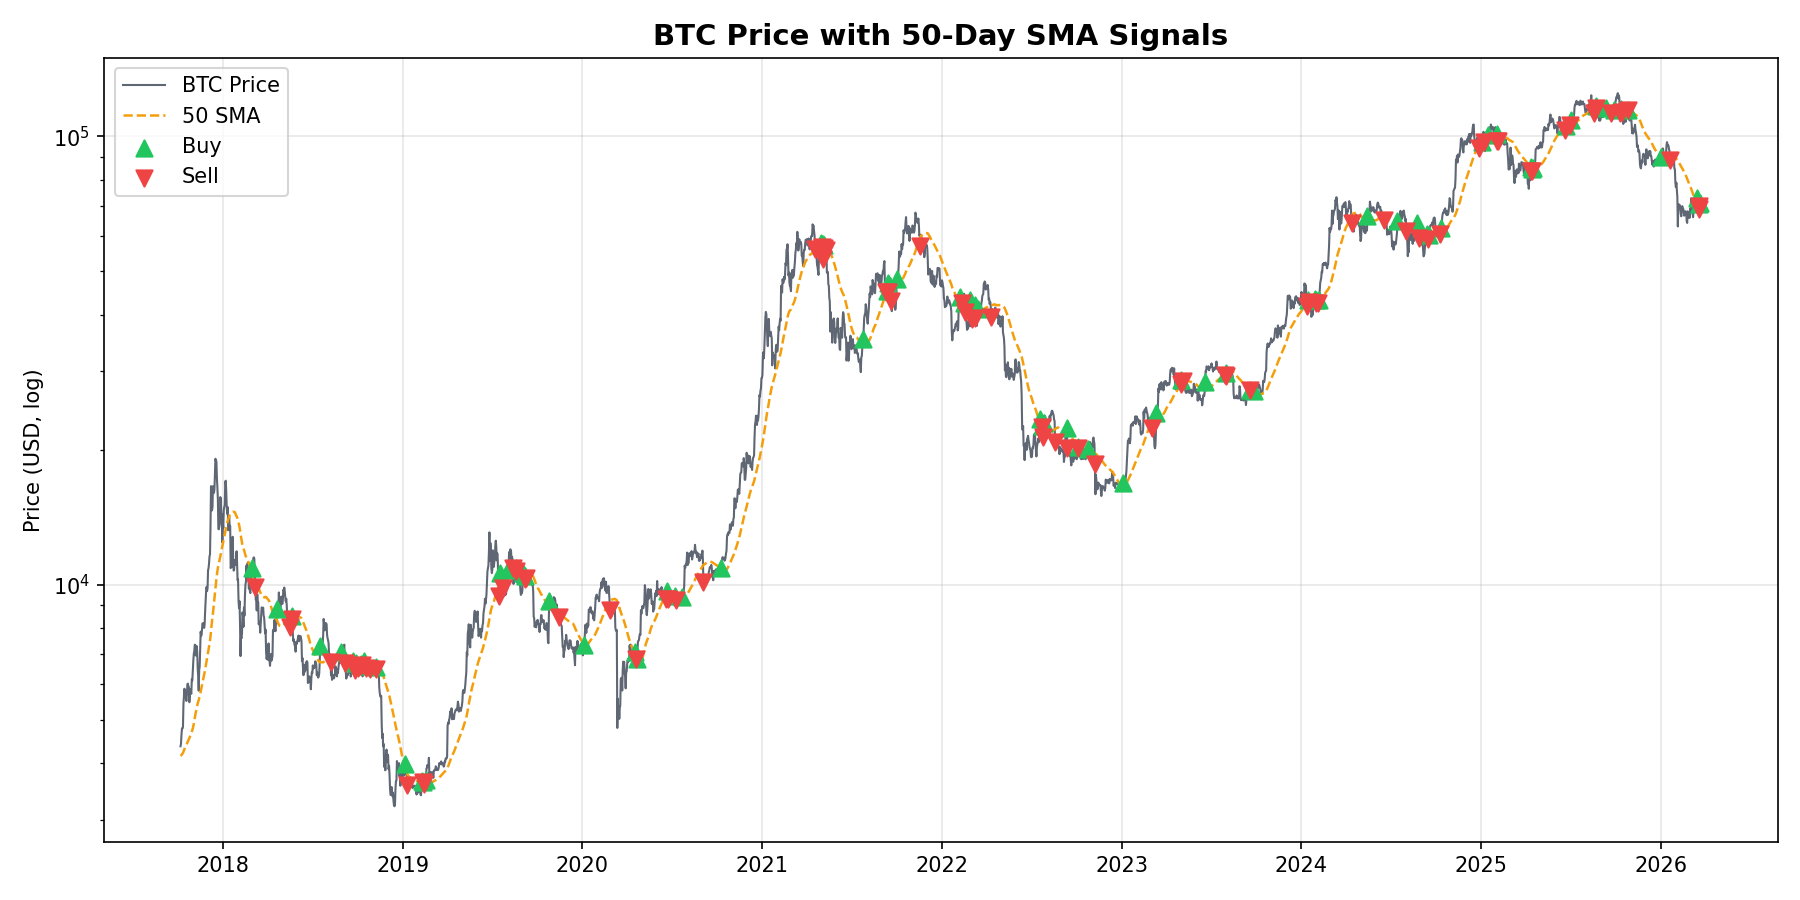
Signal Chart: Buy & Sell Points on BTC Price
The chart below shows every buy (green ▲) and sell (red ▼) signal over the full test period. The yellow dashed line is the 50-day SMA. Notice how the strategy catches major trends early but generates frequent small losses during sideways markets.
Backtest Results
Period: October 2017 – March 2026 (8.5 years). Starting capital: $10,000. Fees: 0.05% per side.
Equity Curve: Strategy vs Buy & Hold
Both lines start at $10,000. The blue line is the 50-day SMA strategy, the gray line is Buy & Hold. Notice how the strategy avoids the worst drawdowns while capturing most of the upside.
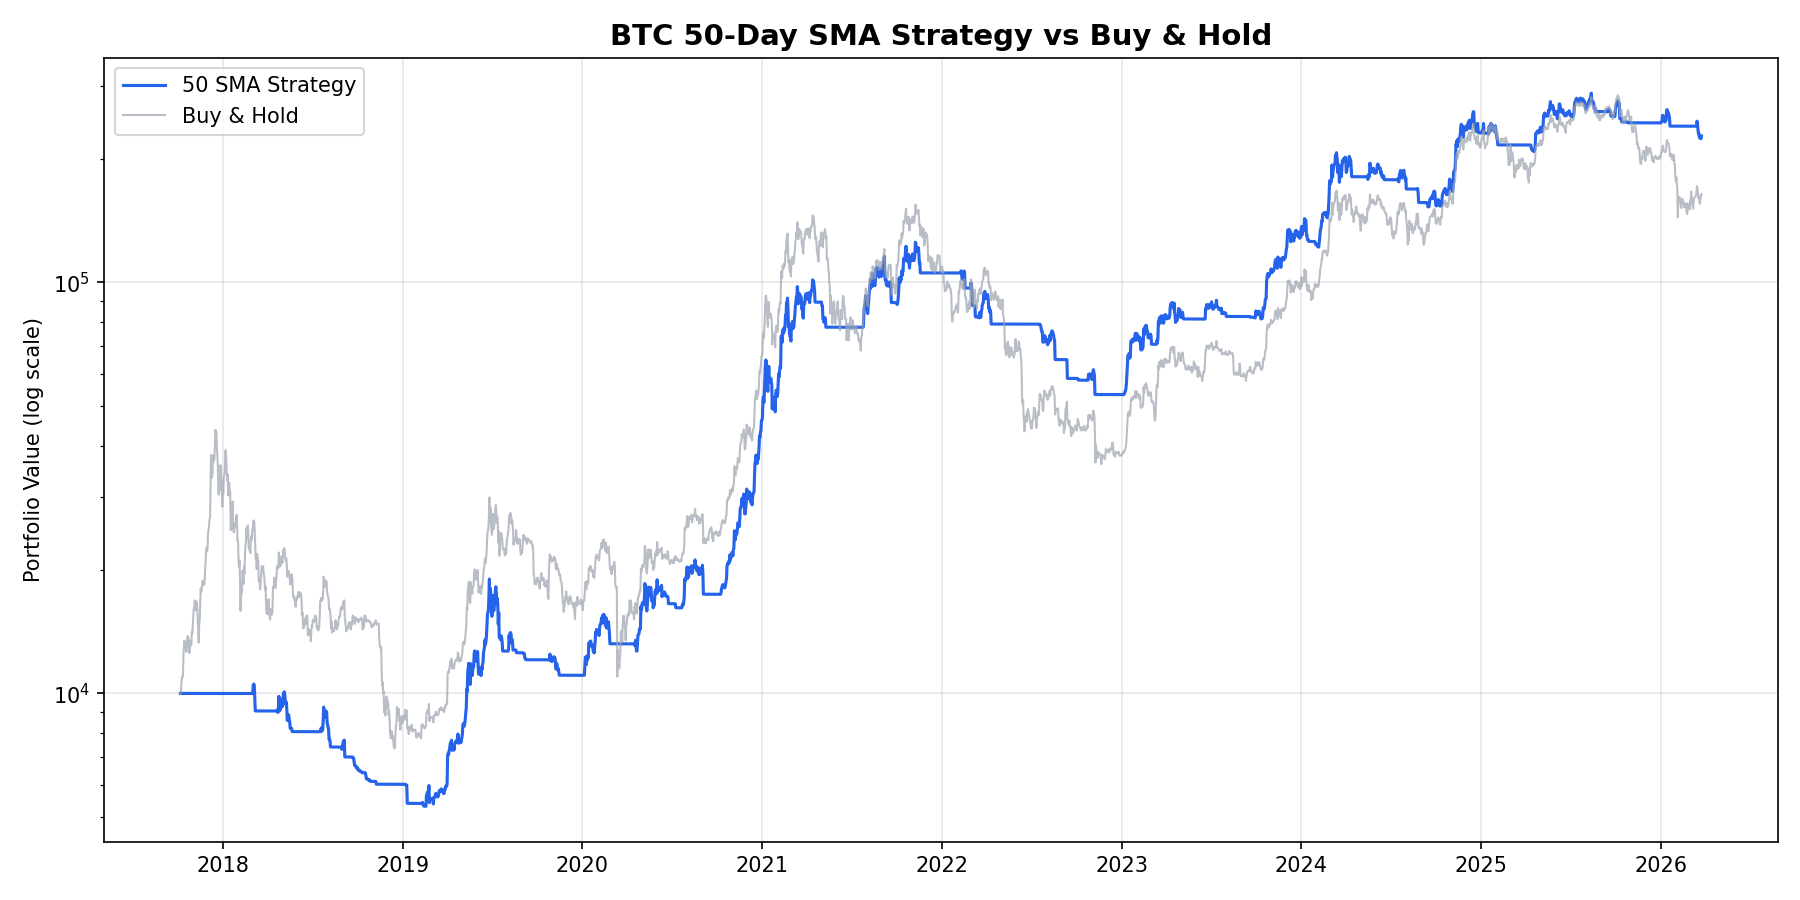
Key observations:
- 2019 breakout: Caught the massive Feb–Jul rally (+157%), entering at $3,668 and riding to $9,440. The 200 SMA would have entered much later
- 2020-2021 mega rally: The single best trade — Oct 2020 to Apr 2021, +414% in 192 days. This one trade alone turned $10k into $50k+ equivalent
- 2022 bear market: While Buy & Hold dropped -83%, the strategy was mostly in cash, taking small controlled losses from false breakouts. Total bear market damage was minimal
- 2024 rally: Caught the Feb–Apr breakout (+48%) and the Oct–Dec run (+51%)
- Final score: Strategy ~$227k vs Buy & Hold ~$164k
Trade Analysis
82 trades over 8.5 years means roughly 10 trades per year — significantly more active than the 200 SMA (31 trades total). The win rate of just 23.2% sounds terrible, but context matters: when the 50 SMA catches a real trend, the average win is +48.1%. When it gets whipsawed, the average loss is only -3.6%. This 13.5x asymmetry is what makes the strategy profitable despite losing 3 out of 4 trades.
Best trade: October 2020 → April 2021, +413.9% in 192 days. This single trade represents the power of trend following — it captured almost the entire 2020-2021 bull run from $10,926 to $56,150.
Worst trade: January 2019, -10.1% in 4 days. Even the worst loss was manageable — a quick stop-out during a choppy period. Compare this to Buy & Hold’s -83% drawdown.
The strategy spends 49% of the time in the market. During the other 51%, your capital sits in cash (or stablecoins yielding 3-8% APR), further boosting risk-adjusted returns.
50 SMA vs 200 SMA: Head-to-Head Comparison
Both are SMA crossover strategies on Bitcoin. Same rules, different speed.
- CAGR: 50 SMA 44.6% vs 200 SMA 26.1% — 50 SMA wins by 18.5 points
- Total Return: 50 SMA +2,170% vs 200 SMA +647%
- Max Drawdown: 50 SMA -57.5% vs 200 SMA -64.1% — 200 SMA slightly worse
- Trades: 50 SMA 82 vs 200 SMA 31 — 50 SMA is 2.6x more active
- Win Rate: 50 SMA 23.2% vs 200 SMA 22.6% — similar
- Time in Market: 50 SMA 49.1% vs 200 SMA 51.2% — similar
Verdict: The 50 SMA is strictly better for Bitcoin in this backtest. It catches trends earlier, exits earlier, and the extra whipsaw losses are more than offset by the earlier entries into major rallies. The 200 SMA is simply too slow for Bitcoin’s cycle speed.
That said, the 50 SMA requires more attention — 82 trades vs 31 means more execution, more slippage risk, and more emotional discipline to keep taking signals after a string of losses.
Why 50 SMA Works for Bitcoin
Bitcoin’s market cycles are faster than traditional assets. Bull runs last 12-18 months (not decades), and bear markets compress into 1-2 years. A 200-day SMA — designed for equity markets with multi-year cycles — is simply too slow. By the time the 200 SMA signals “buy,” the first 30-40% of a Bitcoin rally is already gone.
The 50-day SMA matches Bitcoin’s rhythm better:
- Faster entry into trends: Catches breakouts 2-3 months earlier than the 200 SMA
- Faster exit from reversals: Cuts losses quicker, reducing drawdown severity
- Acceptable whipsaw cost: Yes, 77% of trades lose money — but the average loss is only -3.6%, while the average win is +48.1%. The math works heavily in your favor
- No optimization needed: 50 is a standard parameter used across all markets. We didn’t curve-fit this to Bitcoin
Limitations and Risks
- High trade frequency: 82 trades means more execution risk and potential slippage beyond our 0.05% assumption
- Whipsaw pain: Losing 3 out of 4 trades is psychologically brutal, even when the strategy is profitable overall. Most people cannot follow a system that wrong 77% of the time
- Choppy markets hurt: During 2022 and late 2025, the strategy took repeated small losses as price oscillated around the 50 SMA. These periods test your faith
- Long-only bias: This strategy only profits from uptrends. In a prolonged bear market, it simply preserves capital rather than profiting
- Past performance caveat: Bitcoin’s trend dynamics may change as the market matures. Higher institutional participation could reduce the violent trends that make this strategy work
Complete Trade Log
All 82 trades executed by the strategy. ✓ = winning trade, ✗ = losing trade. The 19 winners generated an average return of +48.1%, while the 63 losers averaged just -3.6%.
Methodology
- Data source: Binance BTC/USDT daily candles via public API
- Period: October 2017 – March 2026 (3,100+ trading days)
- Starting capital: $10,000
- Position sizing: 100% of portfolio per trade (all-in / all-out)
- Transaction fees: 0.05% per side (0.1% round trip) — covers maker fees + estimated slippage
- Execution: Trades at daily close price on signal day
- No leverage, no shorting
- Code: Python with NumPy. Full backtest script available for verification
This analysis is for educational purposes only and does not constitute financial advice. Past performance does not guarantee future results. Always do your own research before trading.
 日本語
日本語 Español
 Português
 العربية
 繁體中文
繁體中文 简体中文
简体中文