
SPX Crashed and Bounced the Next Day — Dead Cat or Real Recovery?
The S&P 500 dropped hard, then surged back the next day. Everyone exhaled. But 236 historical crashes tell a more complicated story — and the answer depends on when you measure.
The Setup
It’s a tale as old as markets: SPX drops more than 2.5% in a single session. Panic fills the timeline. Then the next morning, futures are green. By the close, the index is up. Relief.
But here’s the question no one asks in the moment: Is that bounce the start of a recovery — or just a dead cat that landed on its feet for one day?
We scanned all 236 times the S&P 500 fell ≥2.5% in a single day since 1950. Then we tracked what happened next.
58% of the Time, It Bounces
First, the good news: after a ≥2.5% crash, the market rebounds the next day 58% of the time (137 out of 236 instances). The average bounce is solid, too.
But here’s where it gets interesting. Whether the market bounces or doesn’t bounce on Day 1 has massive implications for what happens next:
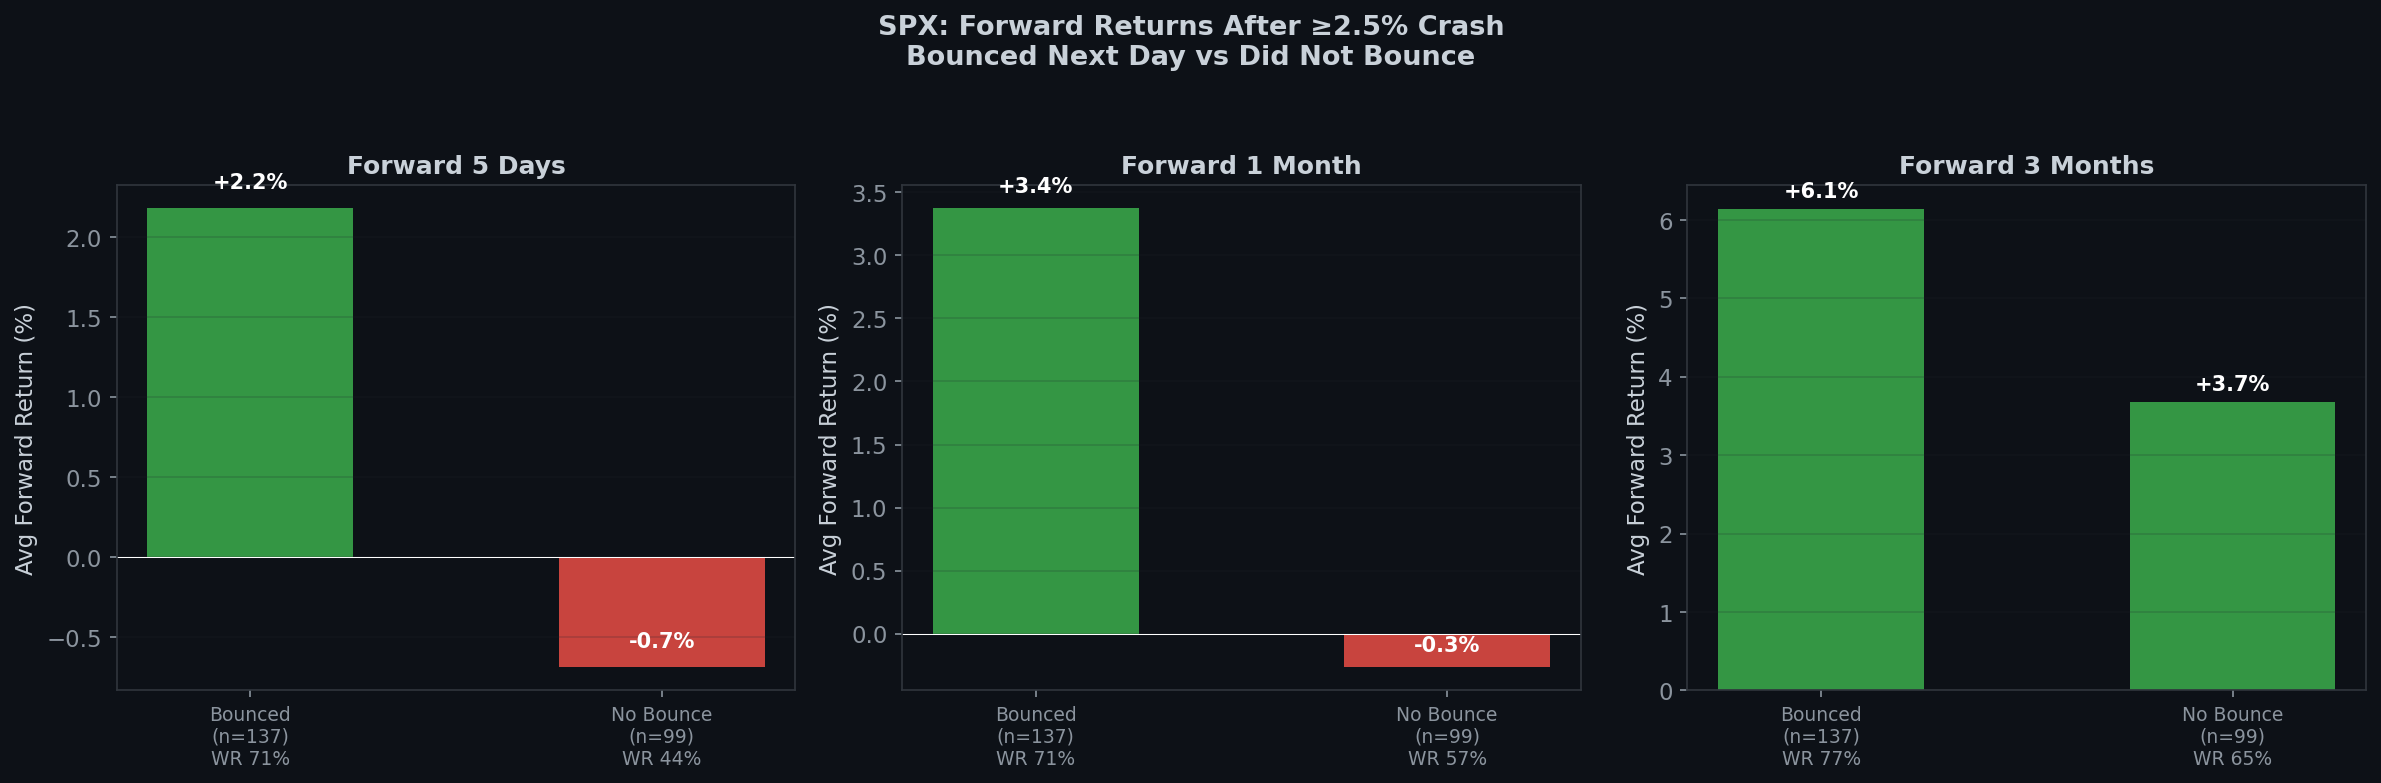
| Period | Bounced Next Day (n=137) | Didn’t Bounce (n=99) |
|---|---|---|
| 5 Days | +2.18% (WR 71%) | -0.69% (WR 44%) |
| 10 Days | +2.34% (WR 69%) | -1.06% (WR 49%) |
| 1 Month | +3.37% (WR 71%) | -0.27% (WR 57%) |
| 3 Months | +6.13% (WR 77%) | +3.68% (WR 65%) |
The split is enormous. If SPX bounces the day after a crash, the 1-month forward return is +3.37% with a 71% win rate. If it doesn’t bounce, the 1-month forward is -0.27% — you’re basically flat.
In short: the next day’s reaction is a genuine signal. A bounce after a crash is statistically better than no bounce.
But Don’t Chase the Bounce
Here’s the trap. The data above measures from the crash day. What happens if you’re the person who waited, saw the bounce, and bought at the close on Day 1?
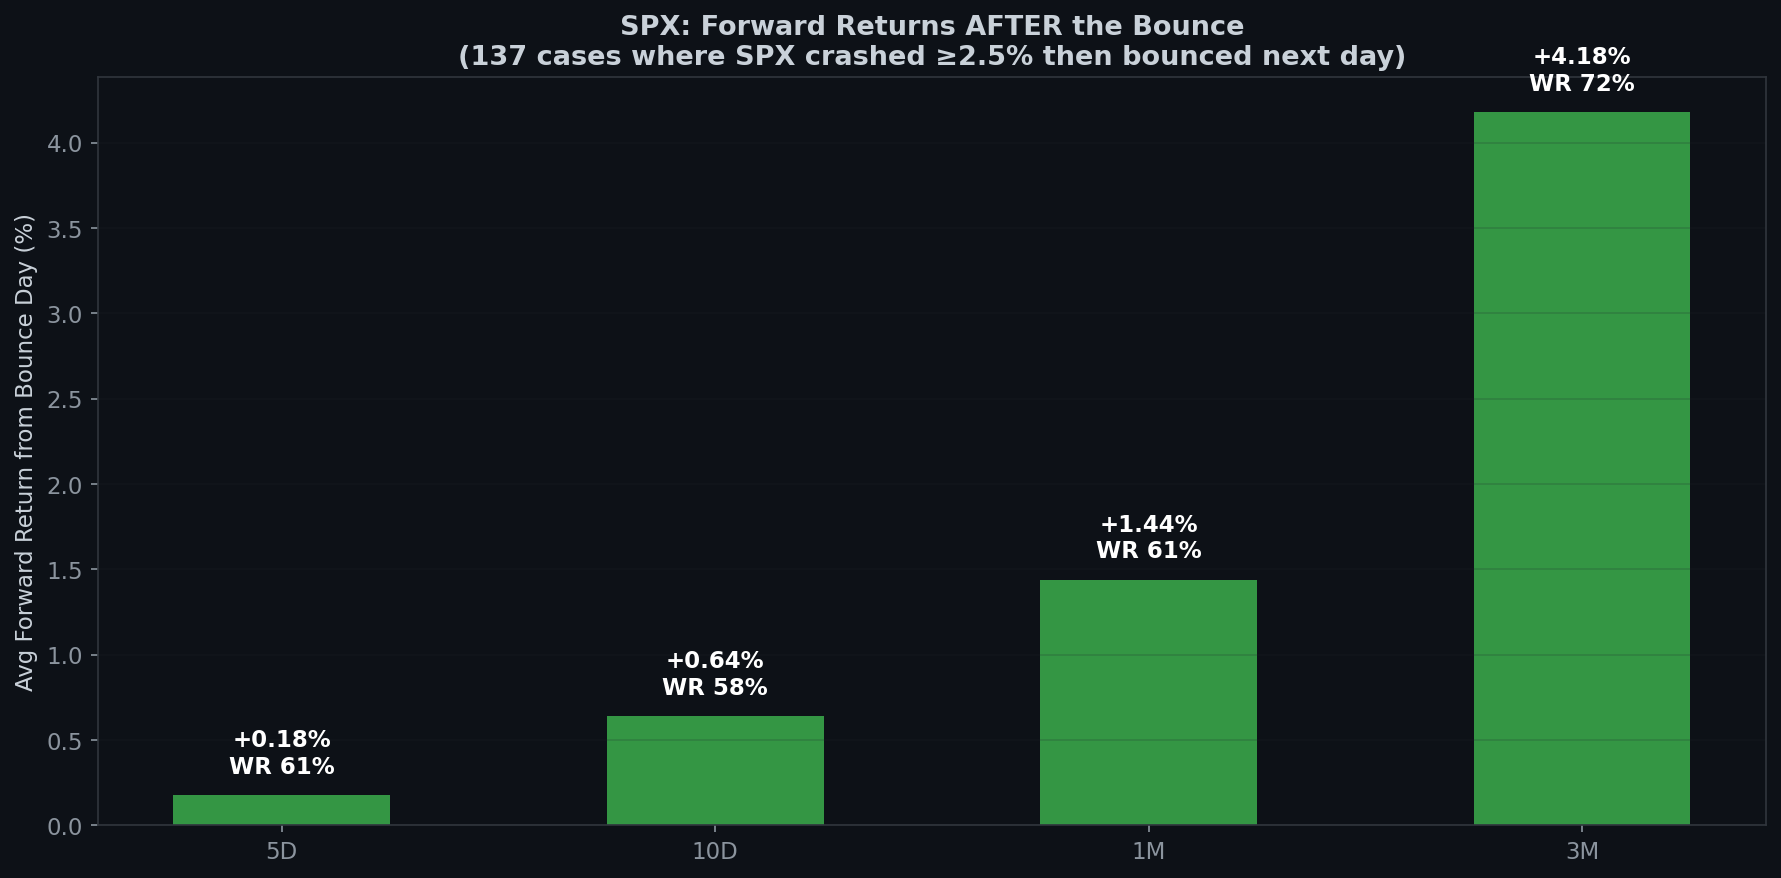
| Period | Avg Return | Win Rate |
|---|---|---|
| Day 2 (next day) | -0.09% | 49% |
| 5 Days | +0.18% | 61% |
| 10 Days | +0.64% | 58% |
| 1 Month | +1.44% | 61% |
| 3 Months | +4.18% | 72% |
Compare this to the crash-day entry:
- Buy the crash: 1-month avg +3.37%, WR 71%
- Buy the bounce: 1-month avg +1.44%, WR 61%
You gave up 1.93 percentage points and 10 points of win rate by waiting one day for confirmation.
And the day after the bounce? It’s literally a coin flip — 49% win rate, average return of -0.09%. Half the time, Day 2 gives back some or all of the bounce.
The Two-Day Illusion
This creates a psychological trap:
- Day 0: SPX crashes -2.5%. You panic, sell, or freeze.
- Day 1: SPX bounces +2%. You feel relief, maybe buy.
- Day 2: SPX is flat or slightly down. You feel foolish.
The data says: the best trade was buying at the close on Day 0 — the worst moment emotionally. By the time you felt comfortable enough to buy (Day 1 close), you’d already given away half the expected return.
This is why the tagline is “Boring is the edge.” The boring, uncomfortable, un-tweetable trade — buying during the panic — is where the returns live.
Case Studies
| Date | Crash | Bounce | Day 2 | 1M Forward |
|---|---|---|---|---|
| 2020-03-12 (COVID) | -9.5% | +9.3% | -12.0% | +1.9% |
| 2020-03-23 (COVID bottom) | -2.9% | +9.4% | +1.2% | +14.4% |
| 2018-12-24 (Christmas) | -2.7% | +5.0% | +0.9% | +8.0% |
| 2024-08-05 (Yen carry) | -3.0% | +1.0% | -0.8% | +5.3% |
| 2025-04-10 | -3.5% | +1.8% | +0.8% | +9.0% |
The COVID sequence is particularly instructive. March 12 saw a -9.5% crash, followed by a +9.3% bounce — then a -12% bloodbath on Day 2. That bounce was the textbook dead cat. But March 23’s bounce was the real bottom. The difference? You can’t tell in real time. Only the data reveals it in hindsight.
The Boring Edge Takeaway
- A bounce after a crash IS a positive signal — historically, it leads to significantly better 1-3 month returns than no bounce.
- But the signal was on Day 0, not Day 1. Buying the crash itself gives you +3.37% avg at 1 month. Buying the bounce gives you +1.44%. The fear premium is real.
- Day 2 is a coin flip. Don’t use it to validate your thesis. It’s noise.
- The uncomfortable truth: The optimal entry is always the one that feels the worst. Markets don’t reward you for comfort. They reward you for enduring discomfort.
This analysis covers 19,182 trading days from January 1950 to April 2026. Forward returns use close-to-close prices. This is not financial advice. Past patterns don’t guarantee future results.
Previous in this series: Same +3% Day, Different Outcome: The VIX Context Effect
Next: Two Green Days After a Crash — The Rarest Recovery Signal
Methodology: A “crash” is defined as any session where SPX closes ≥2.5% lower than the previous day. “Bounce” = positive return on the following trading day. Forward returns are calculated from the specified reference point (crash day close or bounce day close). Win rate = percentage of instances with positive forward returns.
 日本語
日本語 Español
 Português
 العربية
 繁體中文
繁體中文 简体中文
简体中文